Search

The engagement score is a key metric used to understand how satisfied and engaged employees feel across different aspects of the organization. The score can be calculated using either a favorability score or a percentage score, and it can be measured at different levels depending on how the results are analyzed.
In this article, we’ll walk through how engagement scores are calculated, how favorability scores work, and how percentage scores are derived when using one or multiple rating scales.
Engagement scores can be calculated at multiple levels within a survey.
These include:
The favorability score measures the percentage of respondents who provided a positive or favorable response to a question.
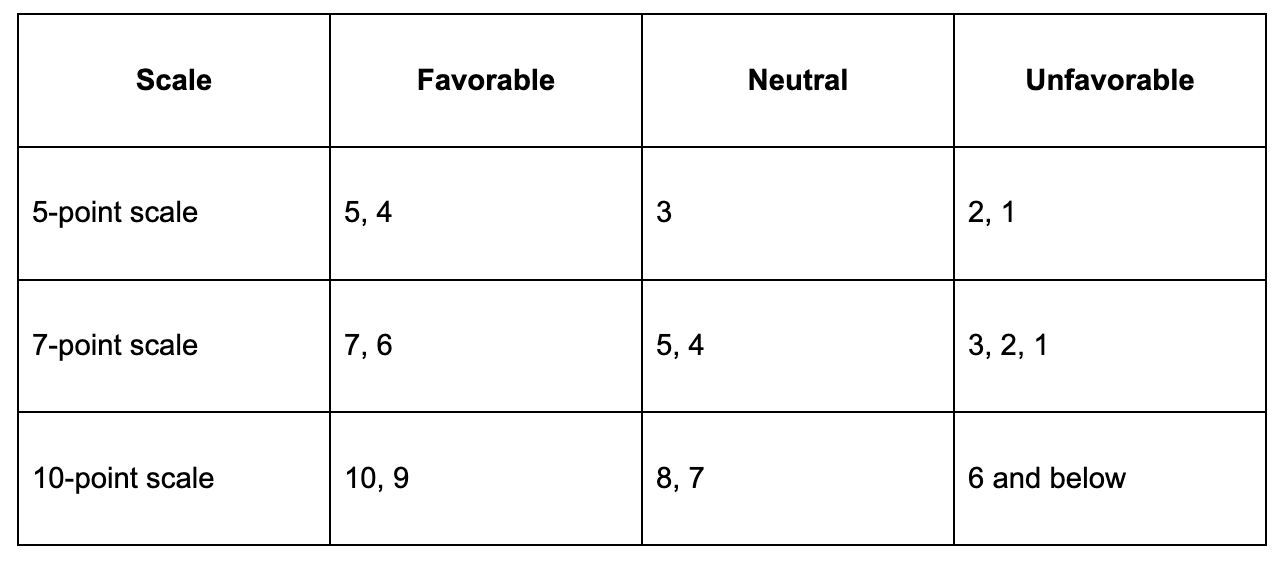
To calculate the favorability score, determine the percentage of respondents who selected favorable responses.

Suppose 100 responses were collected on a 5-point scale, and 60 respondents selected either “4” or “5”.
Calculation:
Favorability score = (60 ÷ 100) × 100
Result:
60% is the favorability score for this example.
The percentage score represents engagement by converting ratings into percentage values.
If a single rating scale is used across the survey, the percentage score is calculated by taking the average of the responses and converting the result into a percentage.
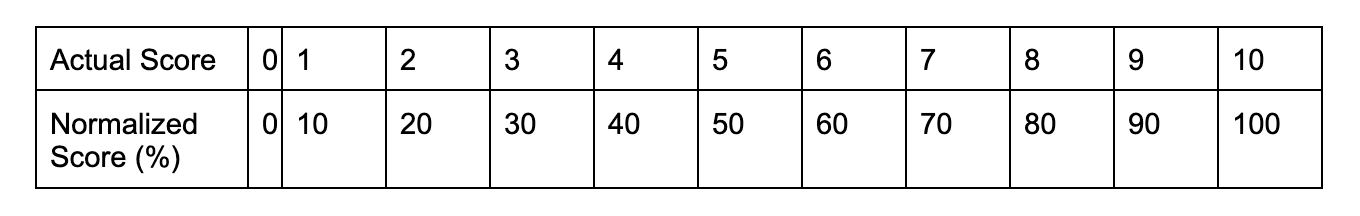
If multiple rating scales are used, responses are normalized to a common 100-point scale so results from different scales can be compared and averaged.
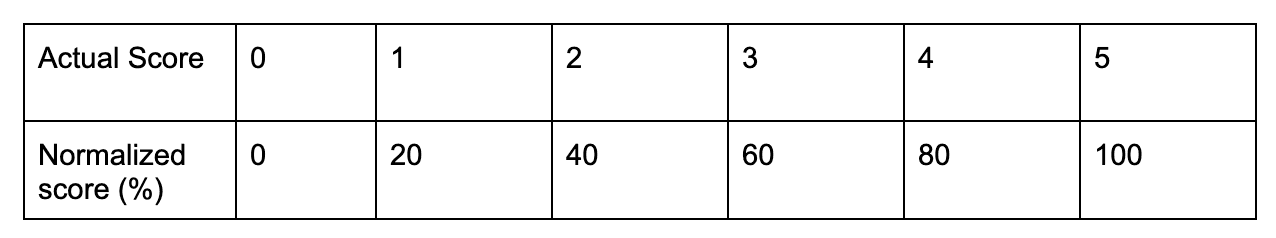
For a 5-point scale
Calculating the average percentage score
Once all responses are converted into percentages, the engagement score is calculated by averaging those values.
Add all converted scores and divide by the total number of responses.
Formula:

In a survey using a 5-point scale, responses to a question include the ratings:
5, 4, 3, 4, 2
Since the same scale is used across the survey, normalization is not required.
Step 1: Calculate the average score
5 + 4 + 3 + 4 + 2 = 18
18 ÷ 5 = 3.6
Step 2: Convert the score to a percentage
3.6 ÷ 5 = 0.72
0.72 × 100 = 72%
Result:
The average score is 3.6, which equals 72% when expressed as a percentage.
Survey responses:
Step 1: Convert the 5-point scale response
4 → 80%
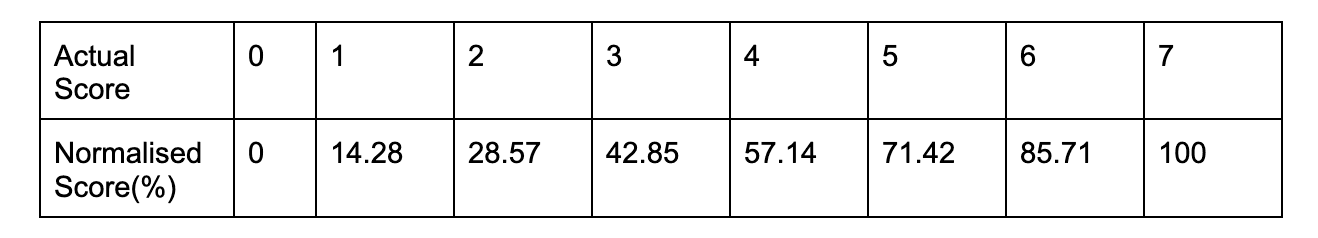
Step 2: Convert the 7-point scale responses
5 → 71.42%
6 → 85.71%
Step 3: Add the converted scores
80 + 71.42 + 85.71 = 237.13%
Step 4: Calculate the average engagement score
Total responses = 3
237.13 ÷ 3 = 79.04%
Powered By SparrowDesk