
How to Create an Analytics (Executive) Dashboard
The Analytics dashboard is an executive dashboard that lets you build custom, visual reports by combining data from several modules into widgets — bar charts, radar charts, line charts, and tables. This article walks you through creating a dashboard, adding widgets, and configuring them from scratch.
Who can create an Analytics Dashboard?
Only users with the Manage Analytics Dashboard permission (typically Admins) can create or edit dashboards. This permission also controls who can grant access to others, as mentioned in step 3.
Step 1: Go to the Analytics page
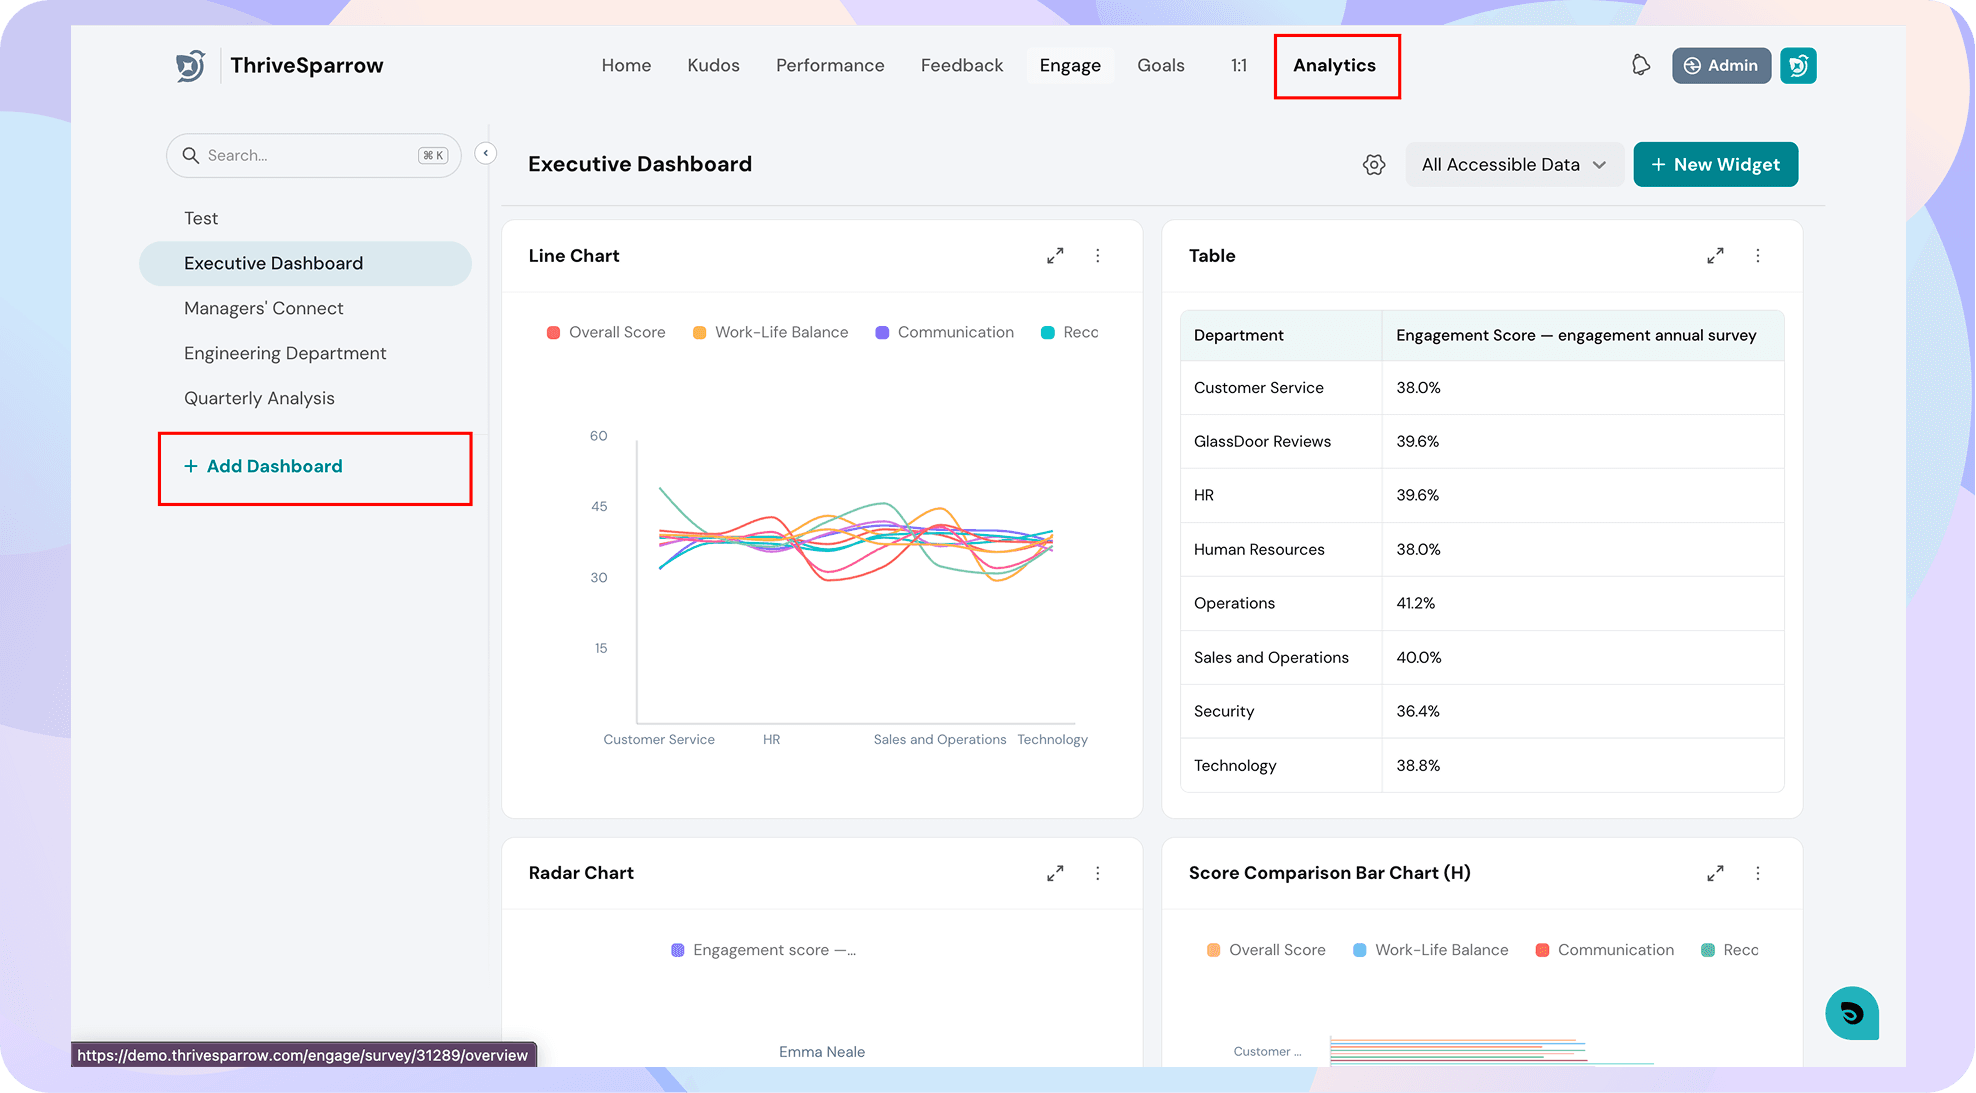
From the employee view of your account, navigate to the Analytics page and click on Add Dashboard.
Step 2: Configure dashboard
Give your dashboard a clear, descriptive name so it's easy to find later (e.g., "Executive Analysis'26" or "Leadership Performance Snapshot").
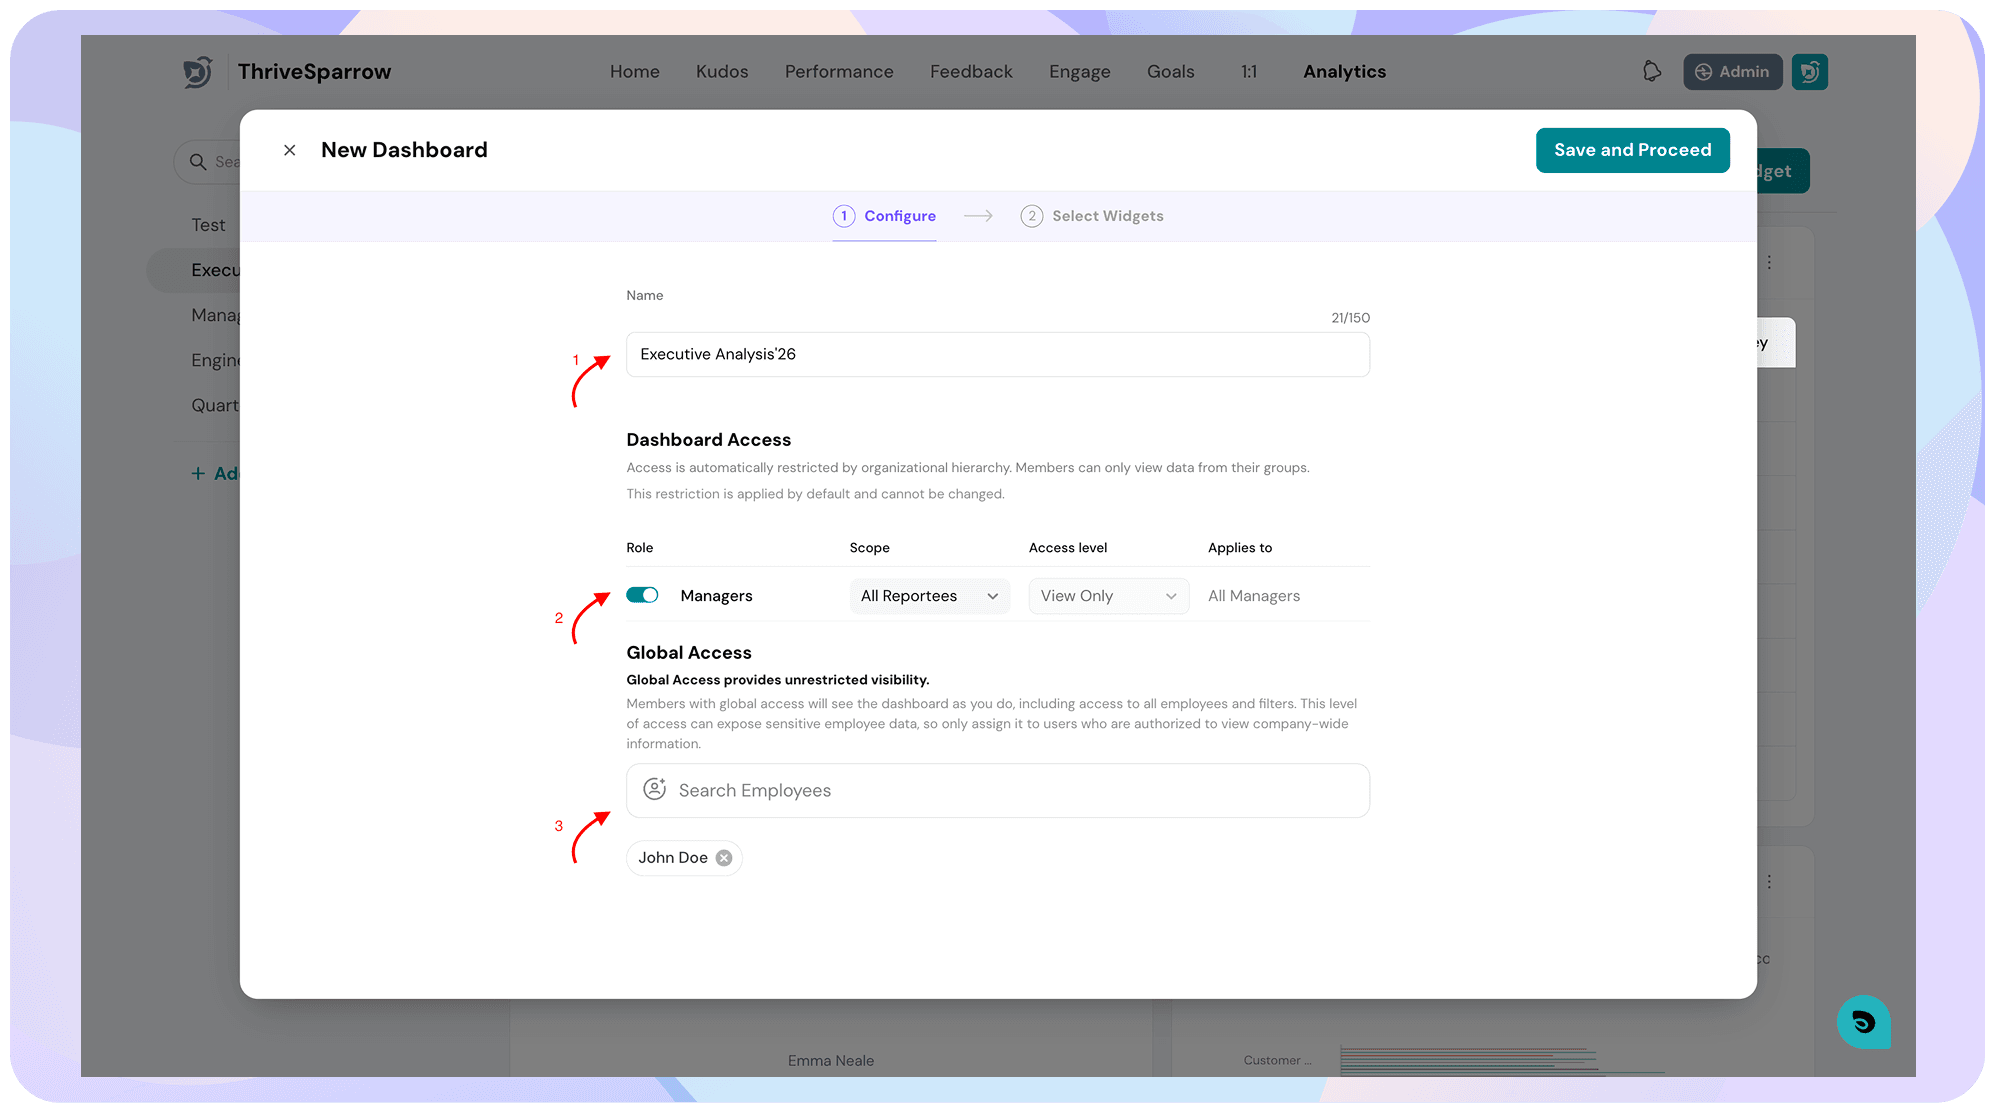
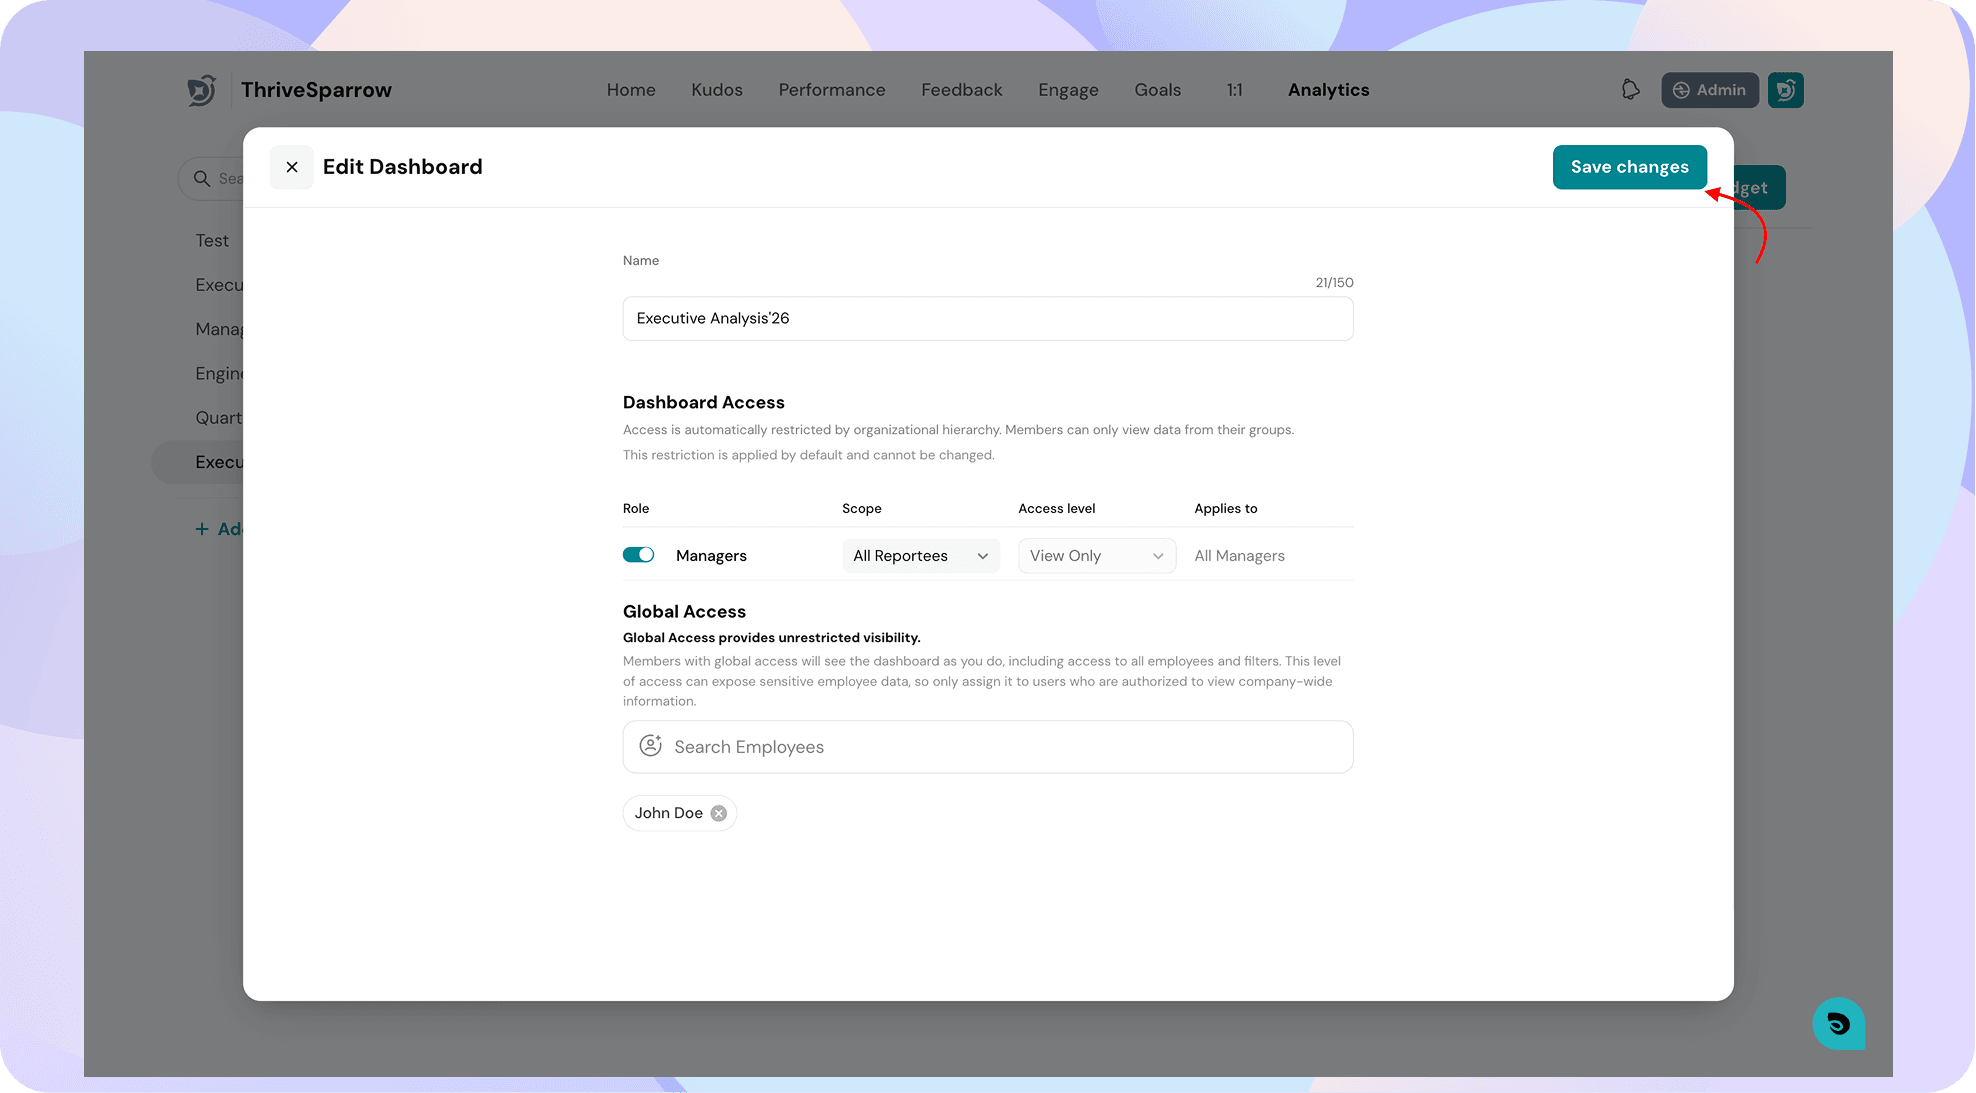
Choose who can view this dashboard:
- Give access to Managers: Managers will only see data for their reportees, based on what each widget is configured to show. You can also select if the manager access should include only direct reportees or the whole reporting line.
- Global access to selected users: Selected users see the complete data, same as the dashboard creator.
Click on Save and Proceed. Don't fret. Access permissions can be changed later as well.
Step 3: Add your first widgets
Once your dashboard is created, you'll be shown a set of sample widgets to choose from. These are pre-configured widgets designed to get you started quickly.
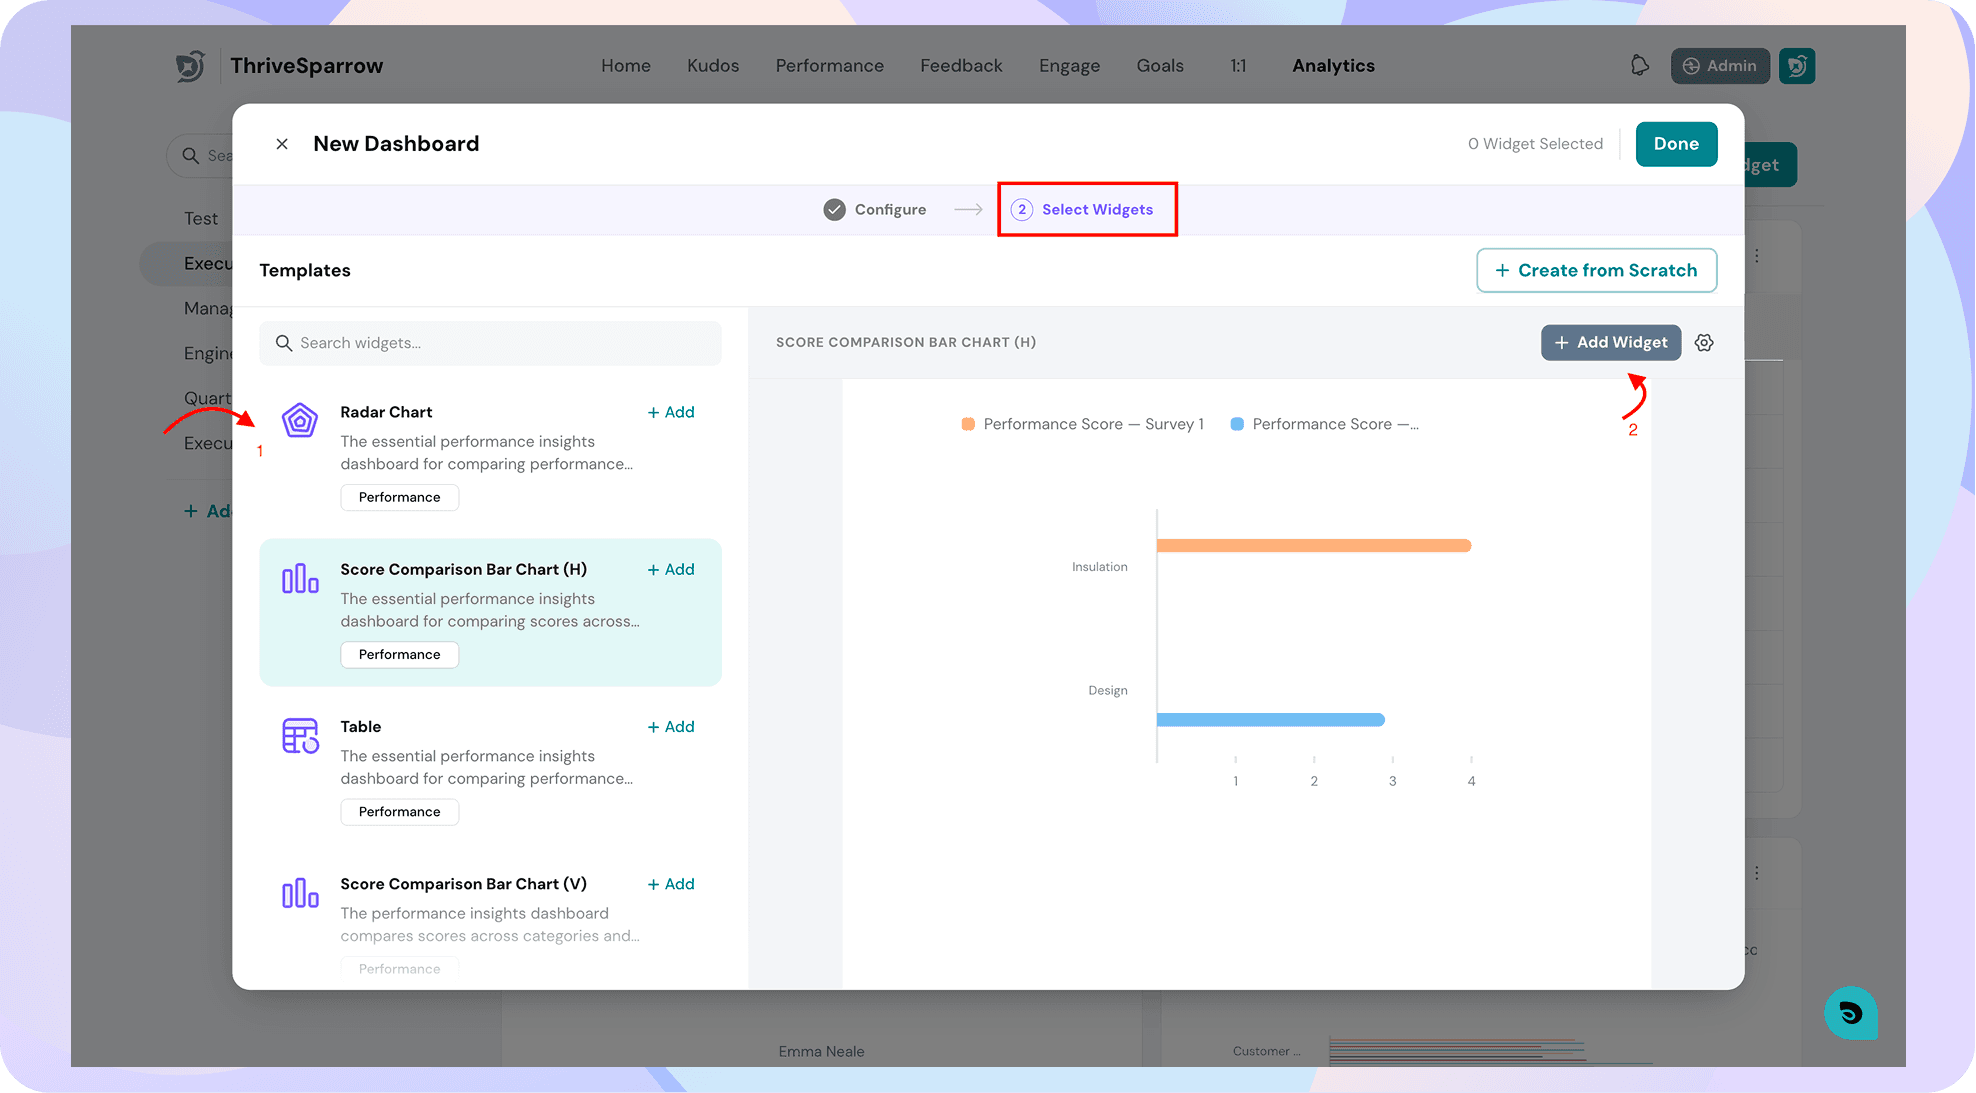
- Adding a sample widget saves it to your dashboard automatically.
- You can edit any sample widget afterward to adjust its data, chart type, or appearance.
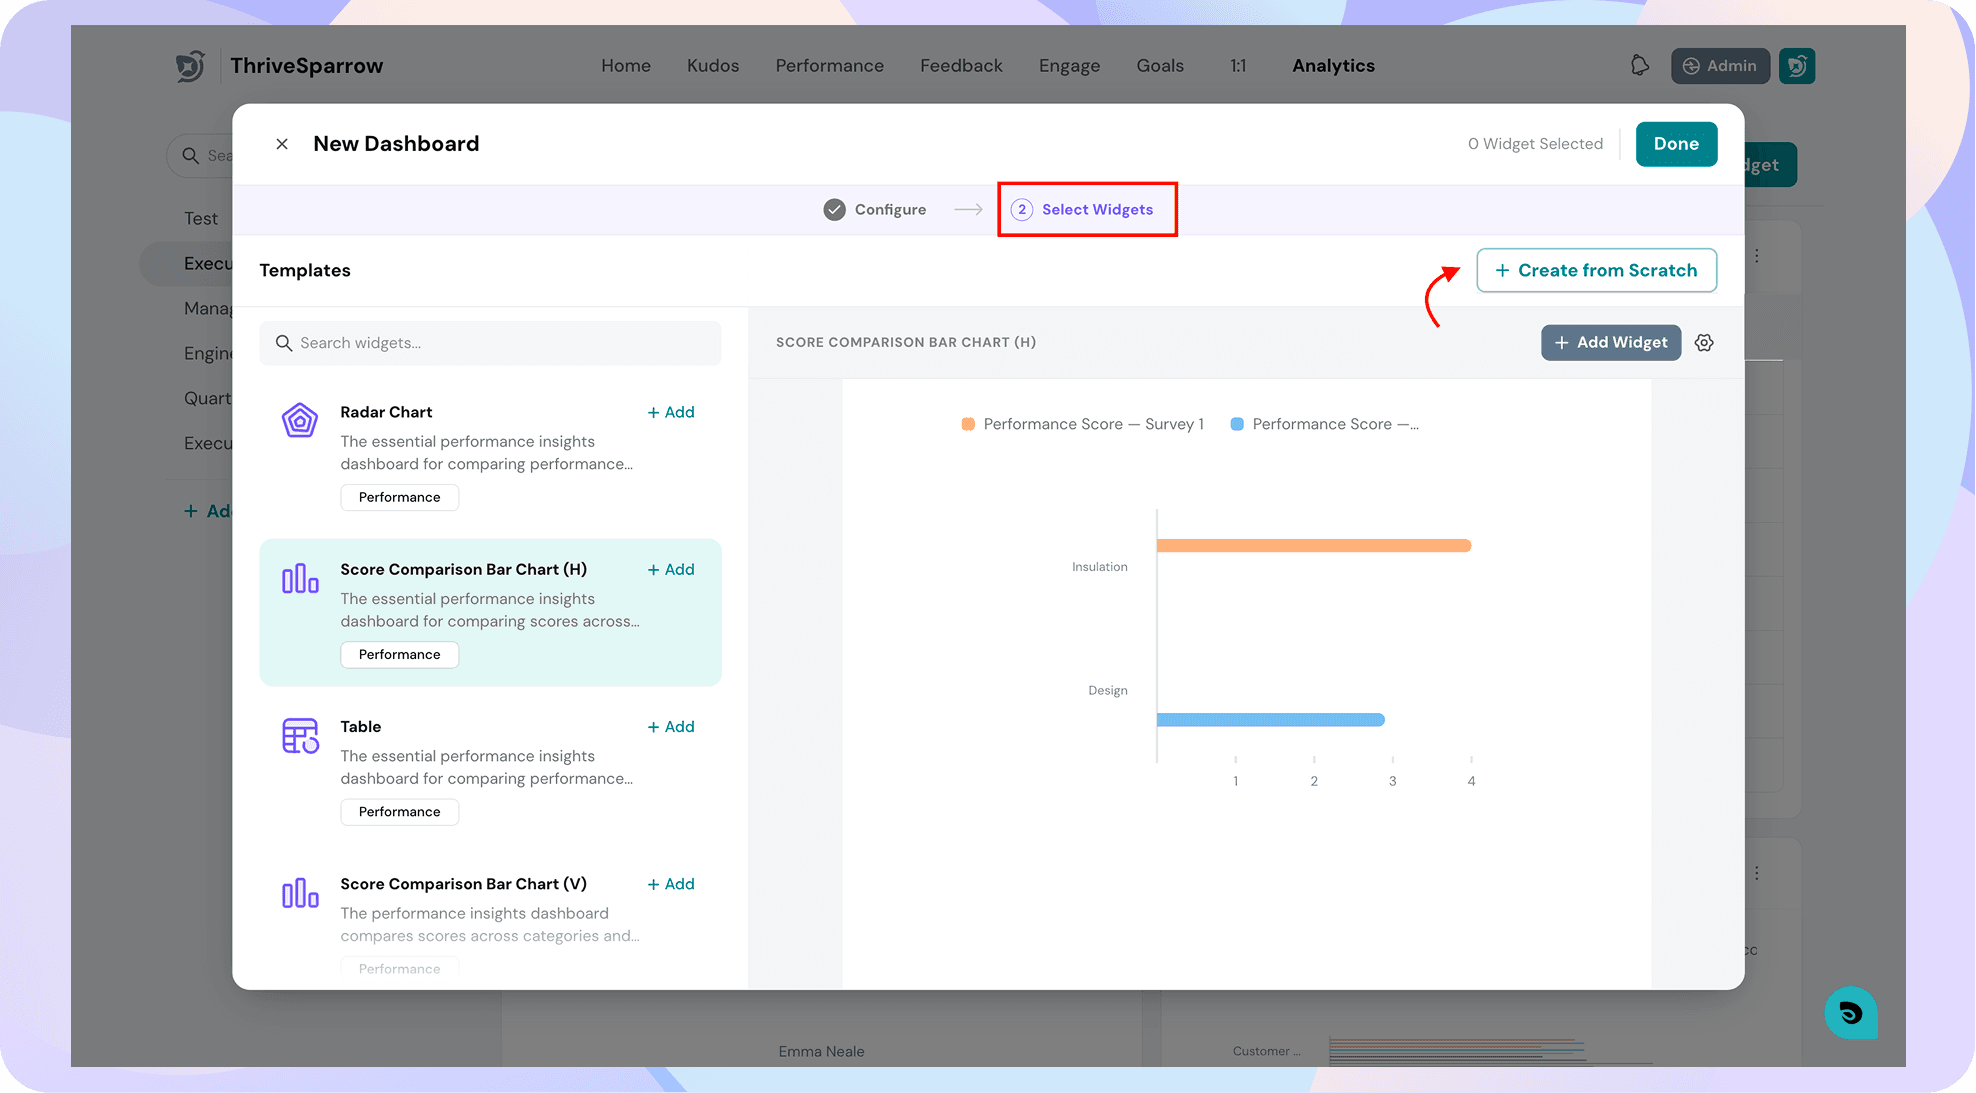
- Prefer to start fresh? Click on Create from Scratch to create your own custom widget, instead of using a sample.
Step 4: Configure a widget
Whether you're editing a sample widget or building one from scratch, the configuration flow is the same:
1. Choose a chart type
Pick one of the four supported visualizations:
- Bar chart
- Radar chart
- Line chart
- Table
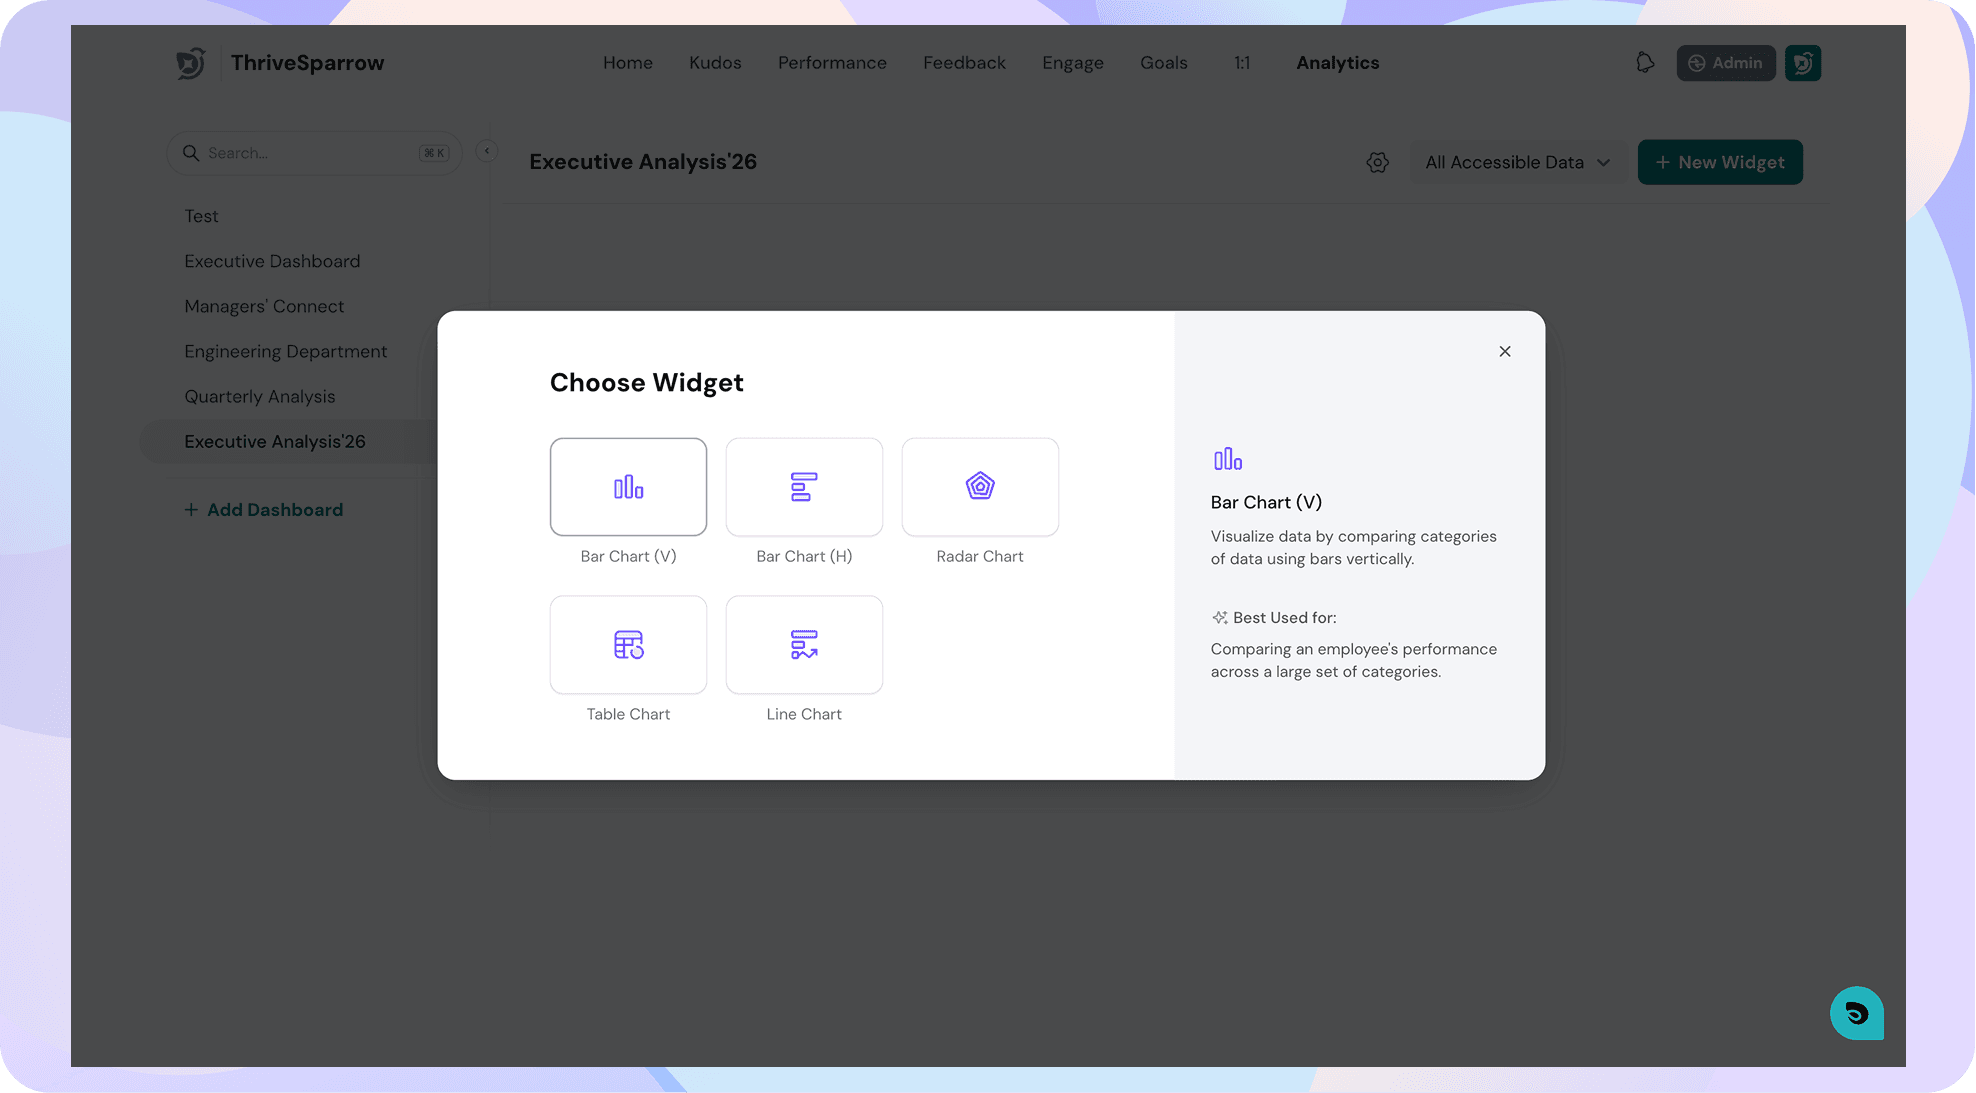
Once the widget is selected, name the widget to match
2. Choose a data source
Select the source that will feed your widget:
- Pulse surveys
- Onboarding surveys
- Exit surveys
- Engagement surveys
- Performance surveys
Within your chosen source type, you can select one or multiple individual surveys to include in the widget (e.g., up to 4 individual Pulse surveys). By default, we preselect the last 4 surveys.
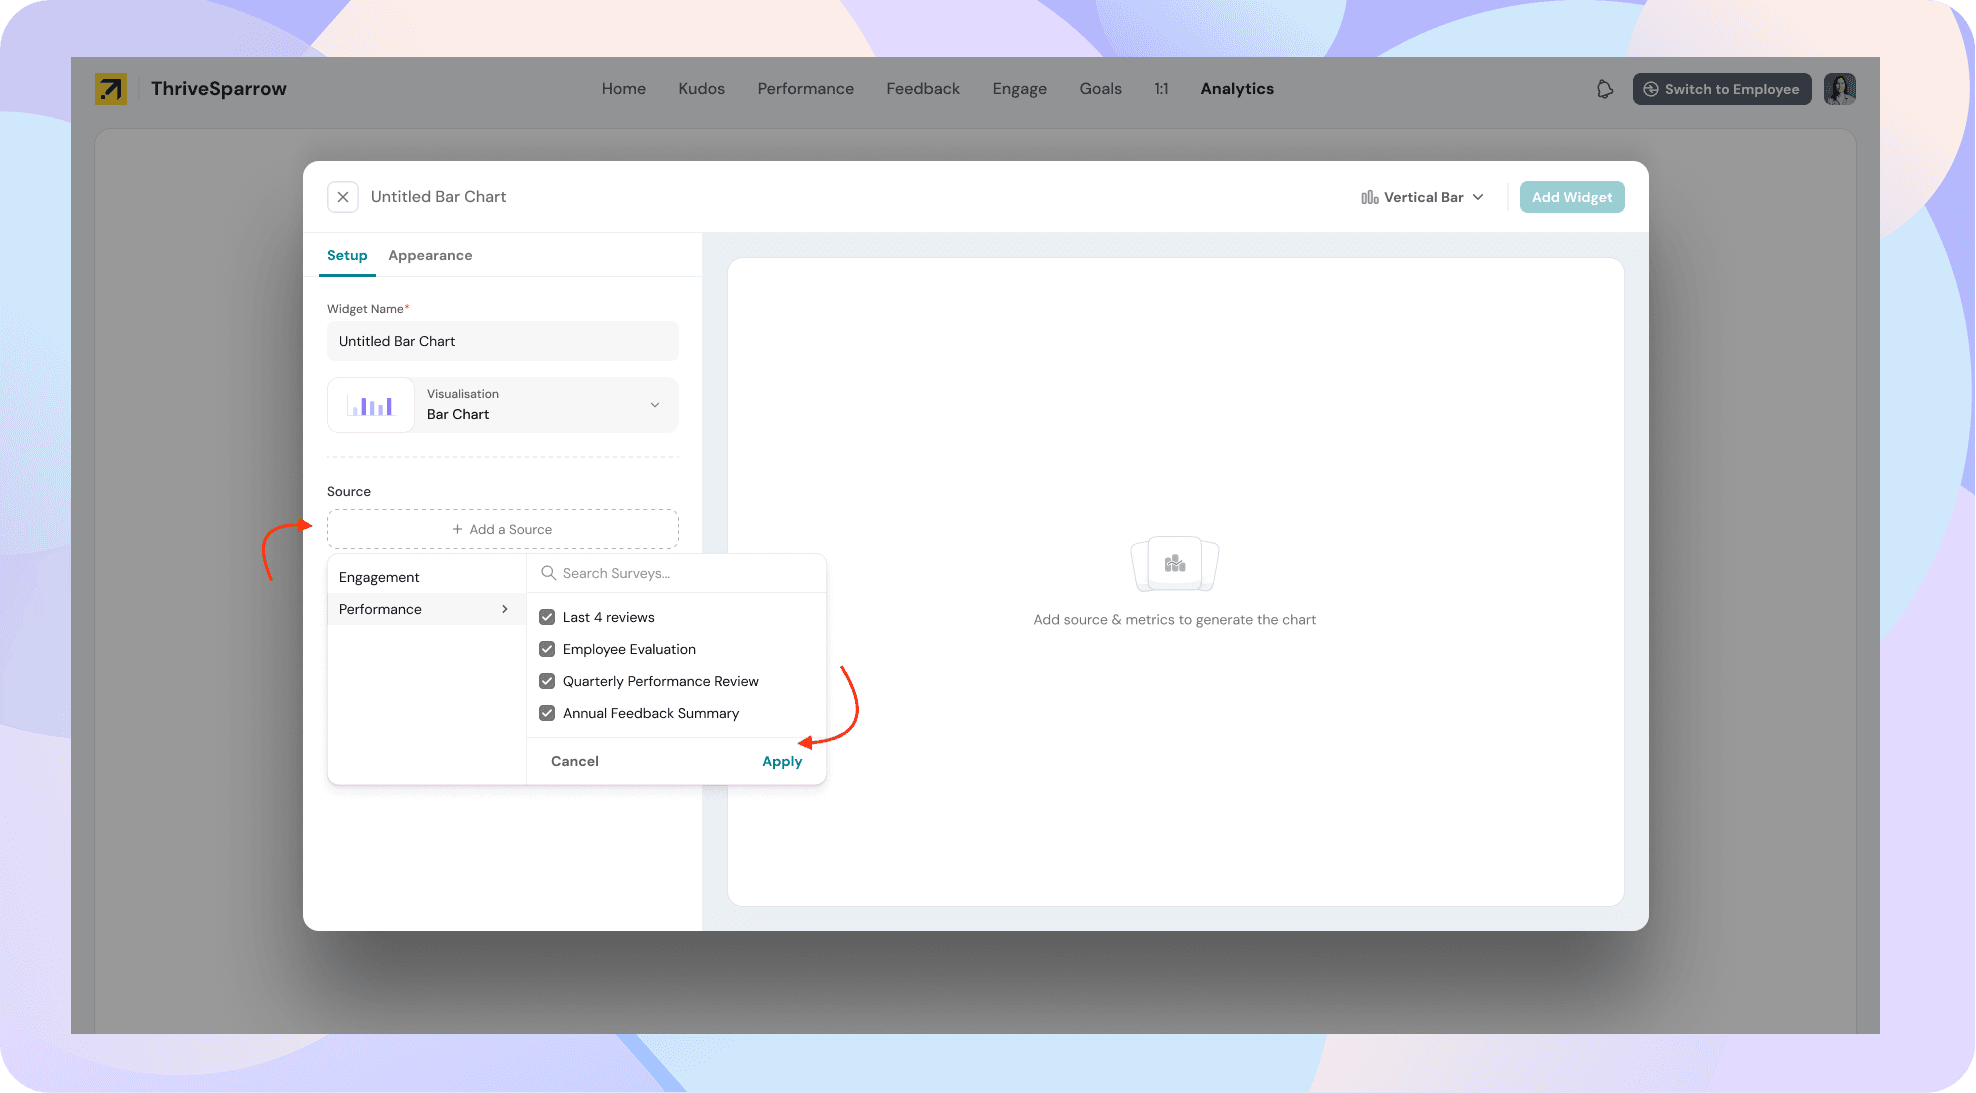
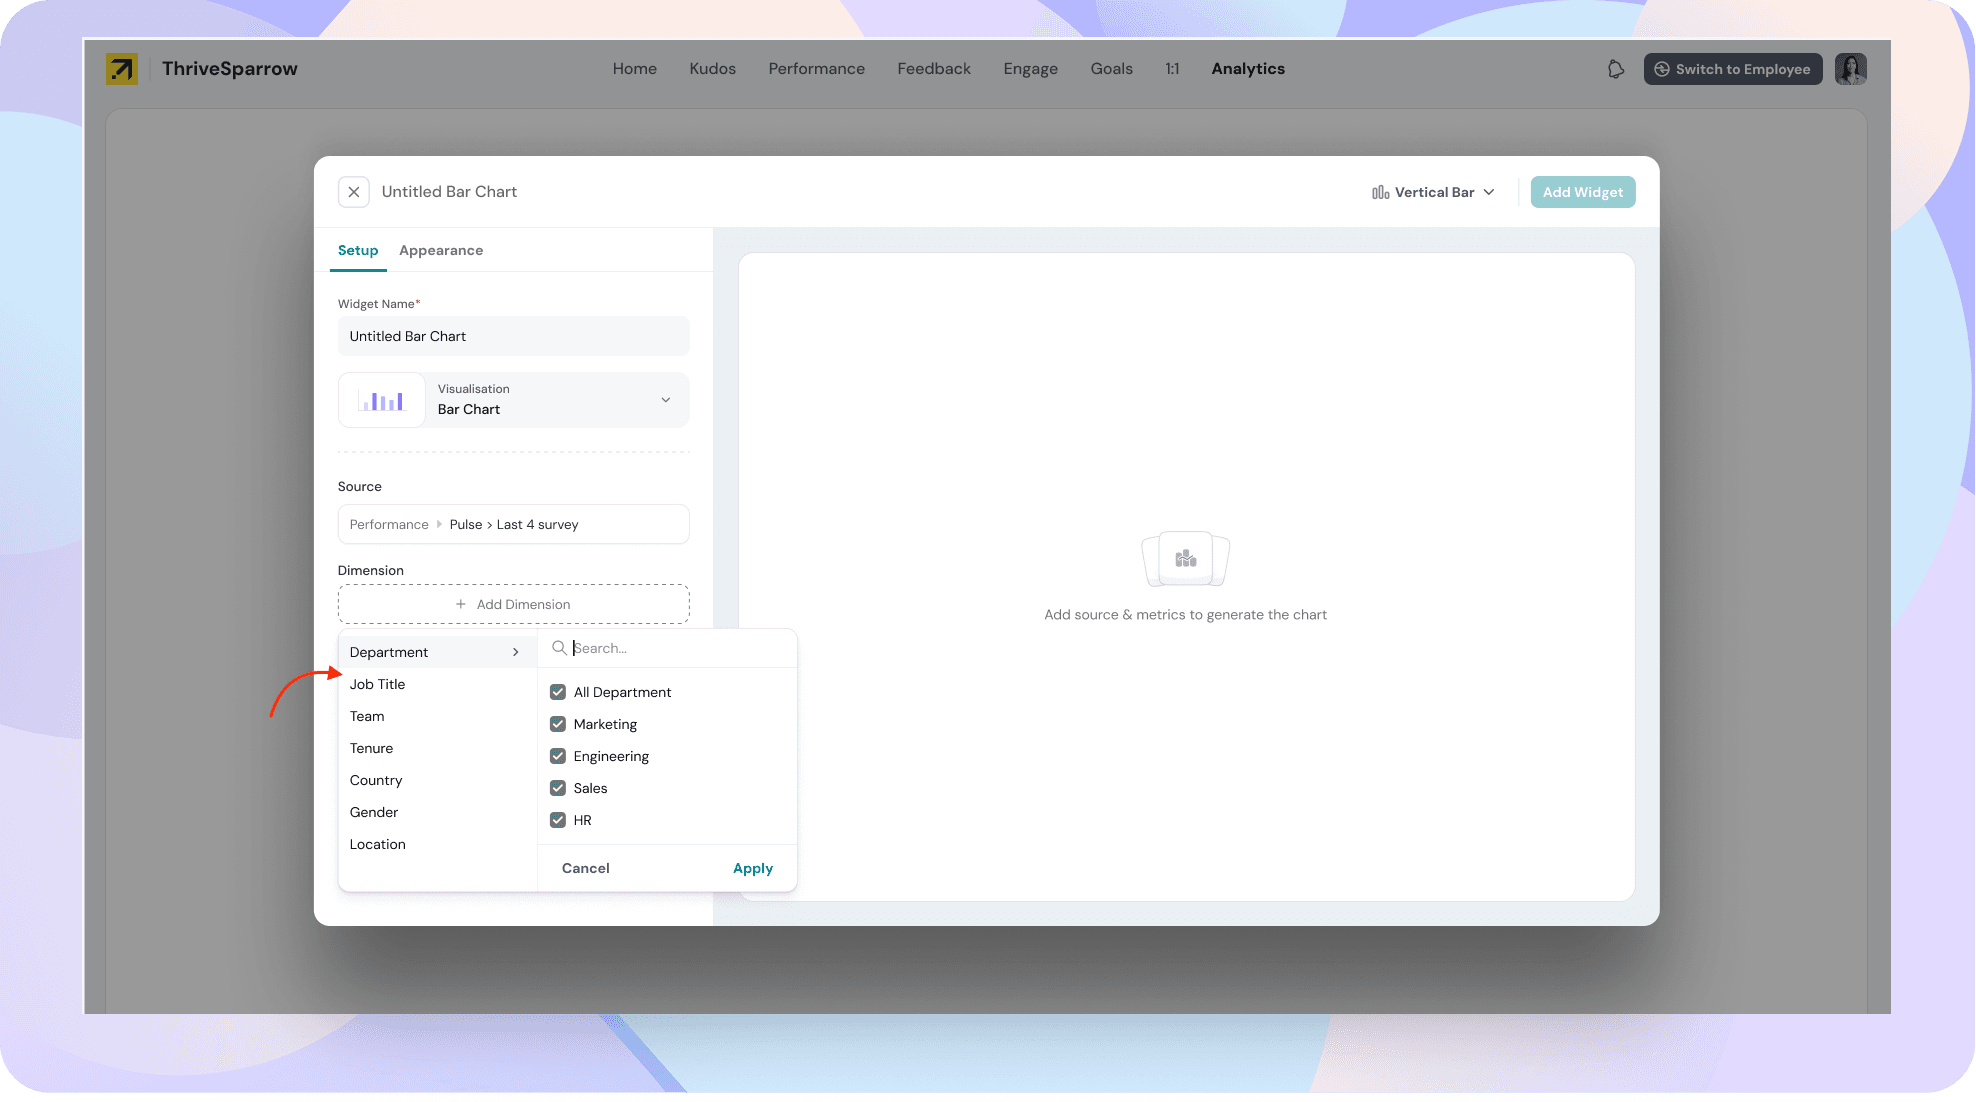
3. Choose your X-axis (dimension)
Select a dimension to group your data by. You can choose from any dropdown-type demographic property (E.g Department, Manager etc) or reporting factors.
4. Choose your Y-axis (score type and metric)
This is a two-part selection involving the score type and the metric.
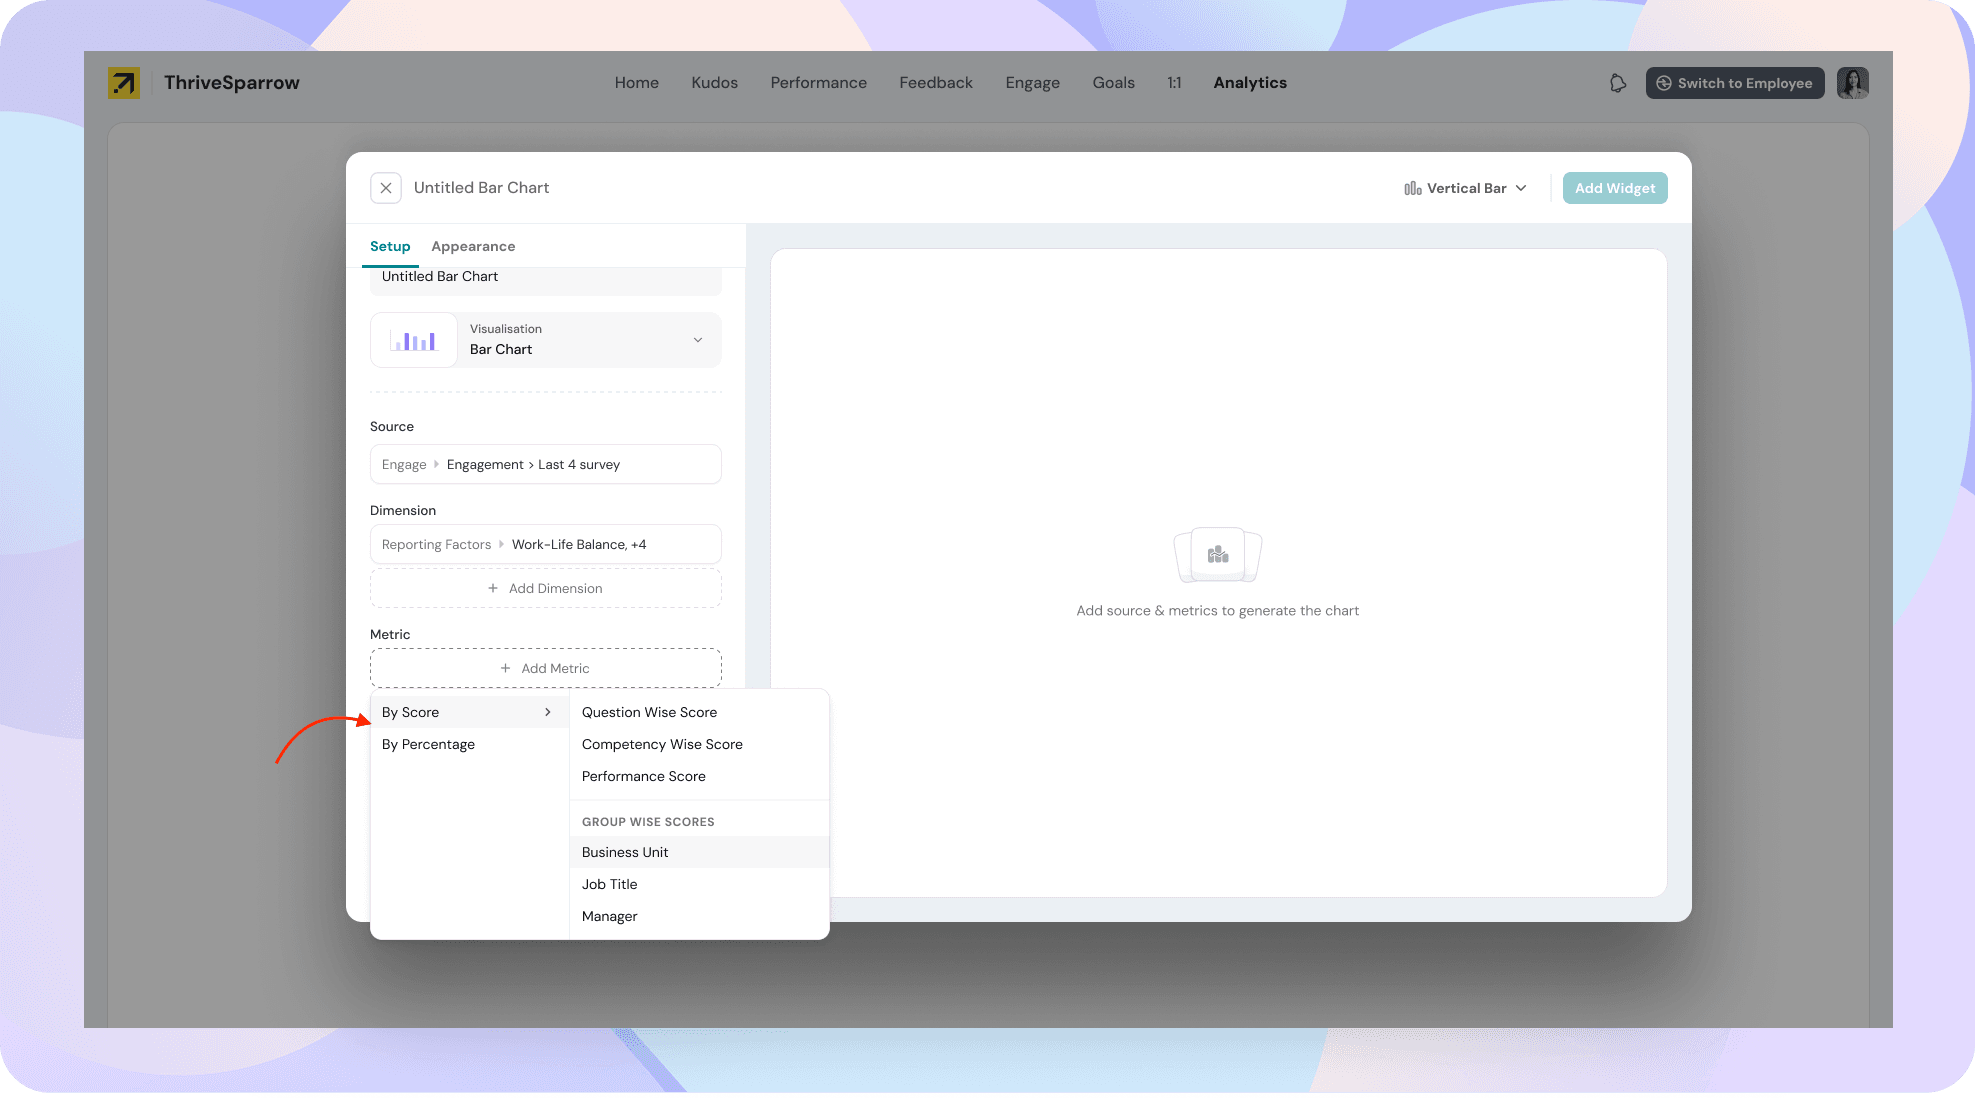
- Score type:
Incase your source is an engage survey, these are the relevant score types to choose from:
- Favourability
- Percentage
- Absolute scores
Incase your source is an performance review, these are the relevant score types to choose from:
- Score
- Percentage
- Metric — once you've picked a score type, choose the metric to plot.
In case of your source is an engage survey, these are the relevant metrics to choose from:
- Reporting factor scores
- Question-wise scores
- Overall Engagement score
- Any demographic property of dropdown-type (E.g Department, manager, etc)
In case of your source is a performance review, these are the relevant metrics to choose from:
- Competency-wise scores
- Question-wise scores
- Overall Performance Score
- Any demographic property of dropdown-type (E.g Department, manager, etc)
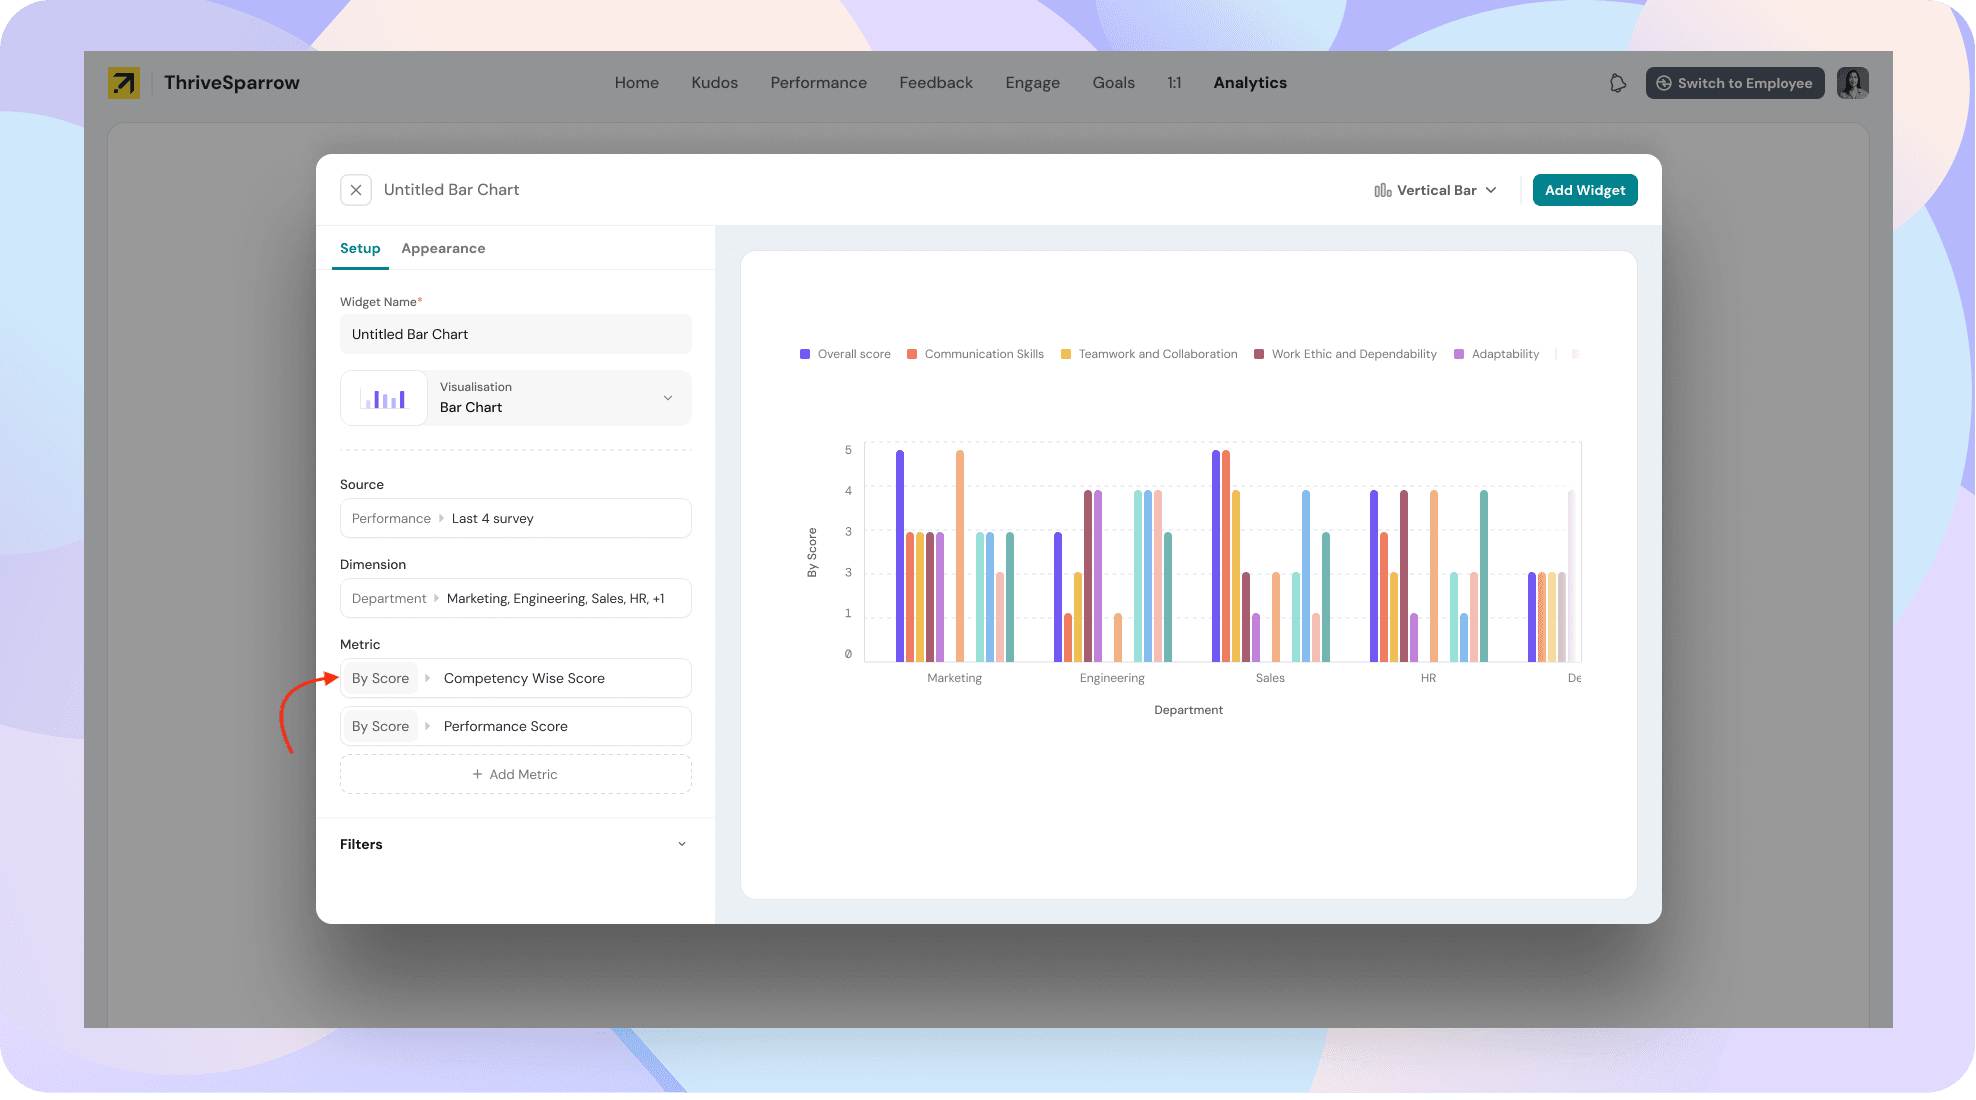
5. (Optional) Add filters and customize appearance
After saving, you can further refine the widget by:
- Adding filters to narrow down the data shown
- Changing the appearance of the chart using available themes
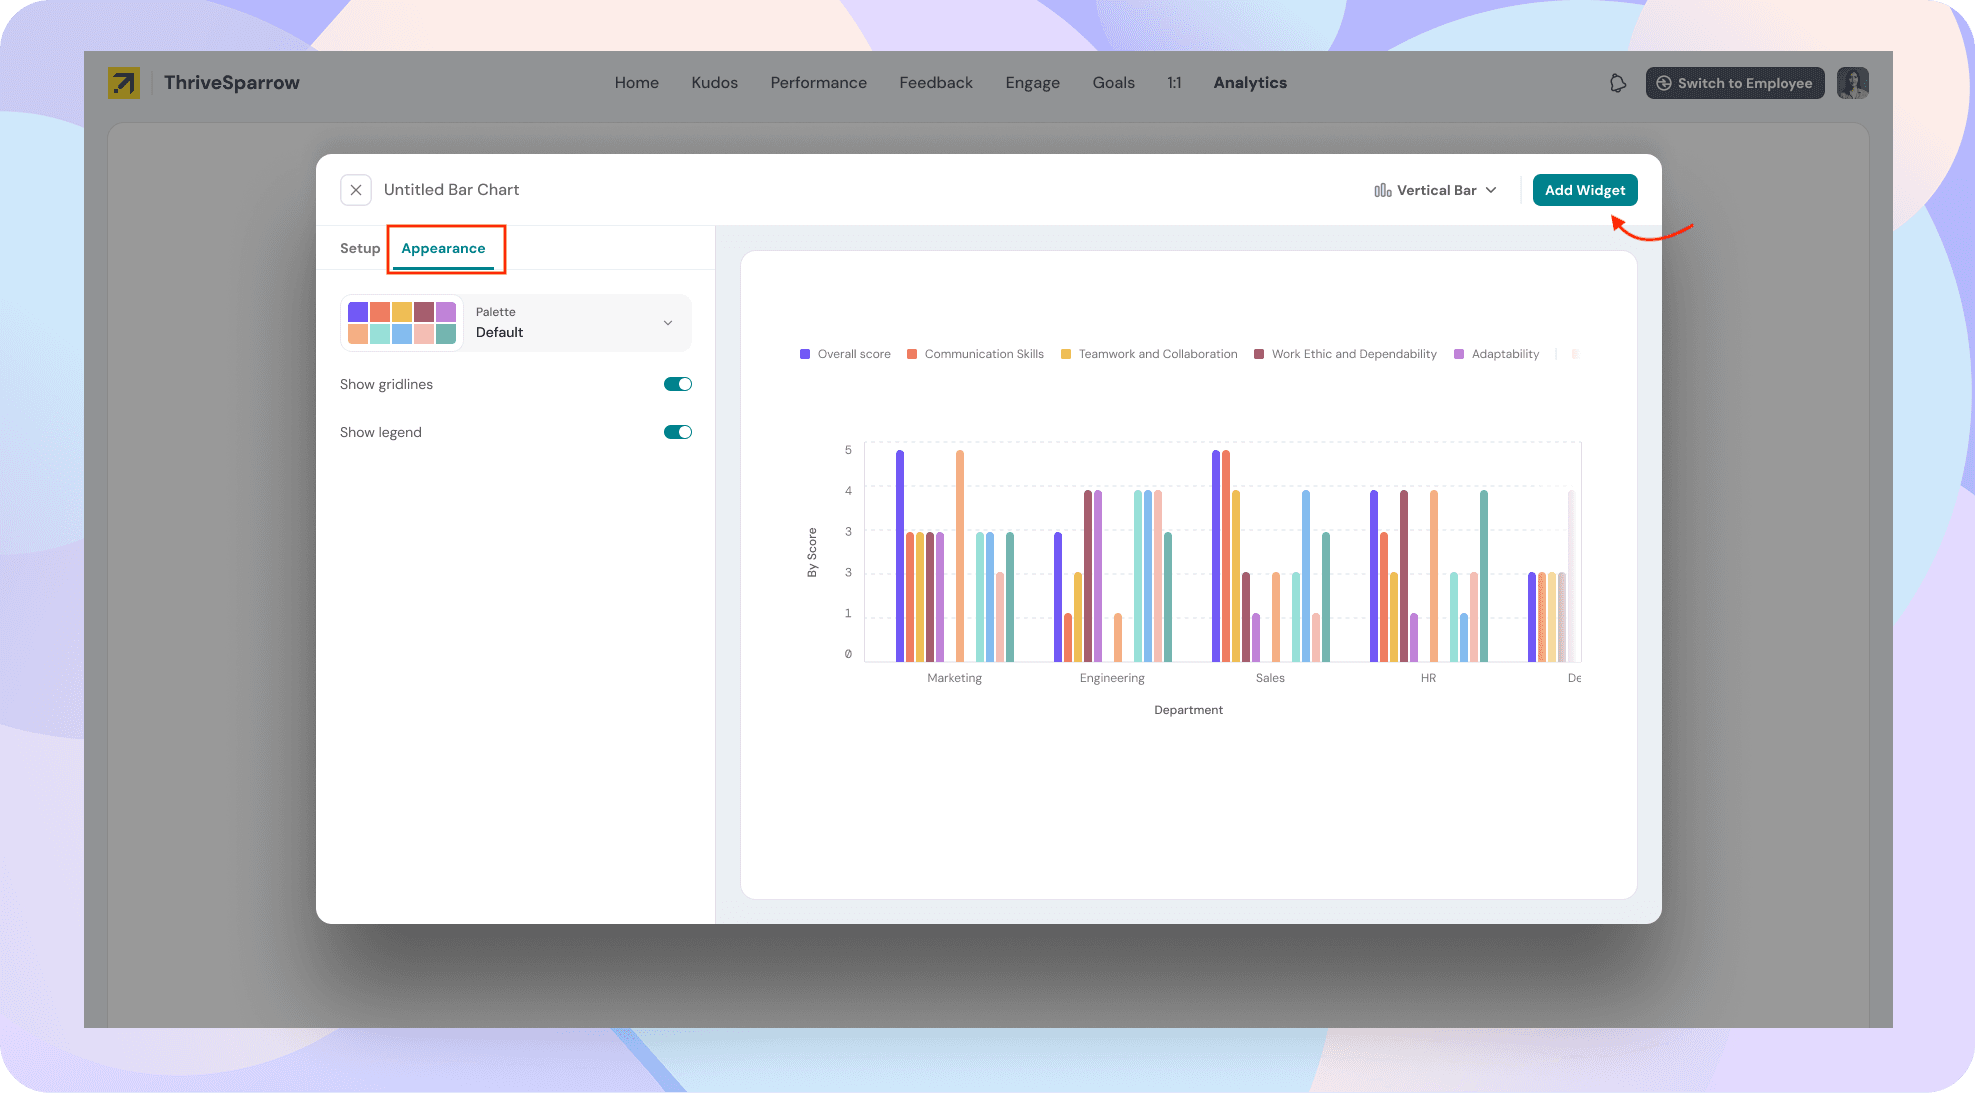
Click on Add Widget to save the widget and add it to the dashboard.
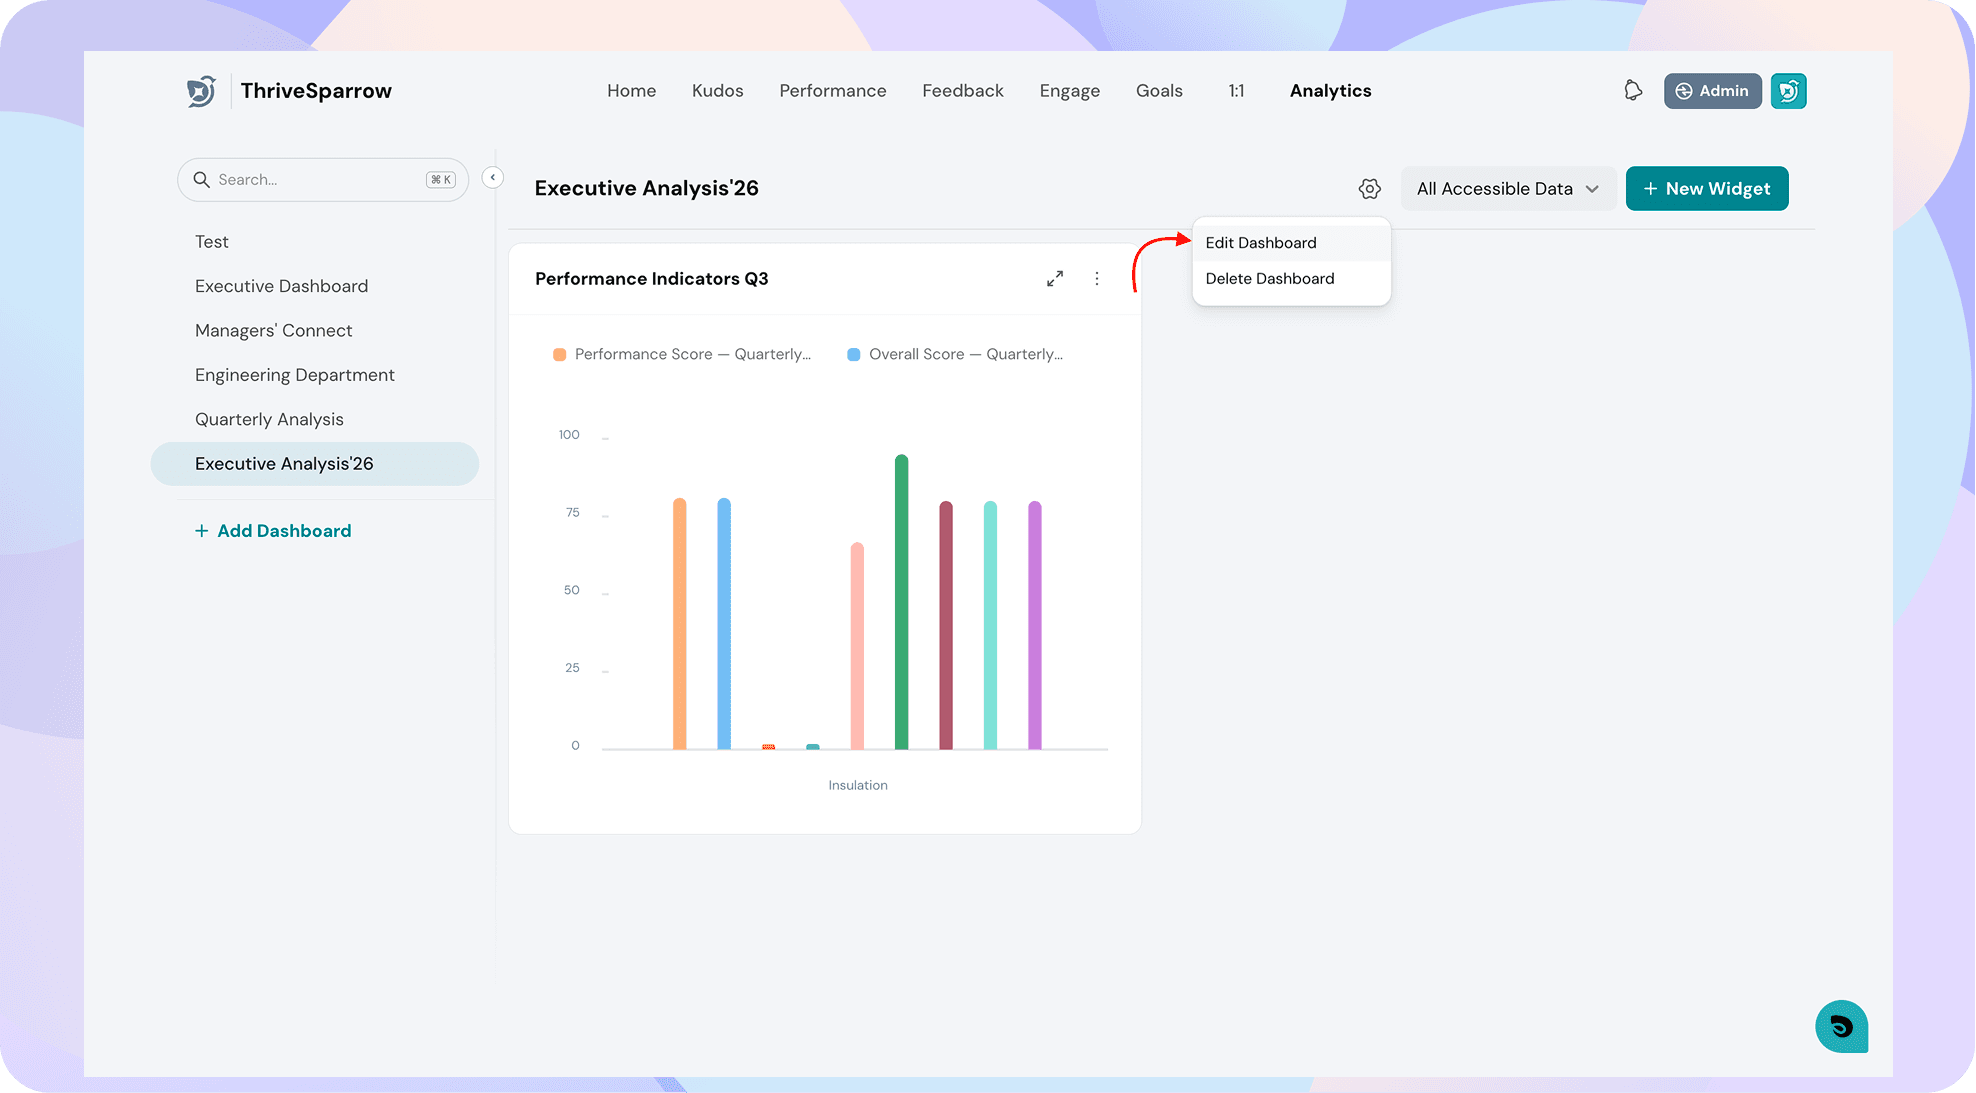
Editing Dashboard Access
Need to add or remove viewers after the dashboard is live? Access settings can be edited anytime at the dashboard level by clicking on the Settings icon at the top right.
Note:
- There's no limit on the number of widgets you can add to a dashboard, or the number of dashboards you can create.
- Viewer data visibility depends on how access was granted. Managers see reportee-level data, while Global access users see full data.
Need more help? Reach out to our support team, and we'll be happy to assist.