Box Grid is a two-dimensional performance matrix that helps you plot employees based on two dimensions, such as overall score and competency score.
Instead of ranking employees on a single metric, Box Grid provides a visual representation of how individuals perform across both axes.
Creating a Box Grid
You can create and configure box grids directly from your performance report.
- Navigate to your Performance Report.
- Click Box Grid in the left sidebar to expand the section.
- You will see a Default Box Grid already created.
- Click the + icon next to Box Grid to create a new grid.
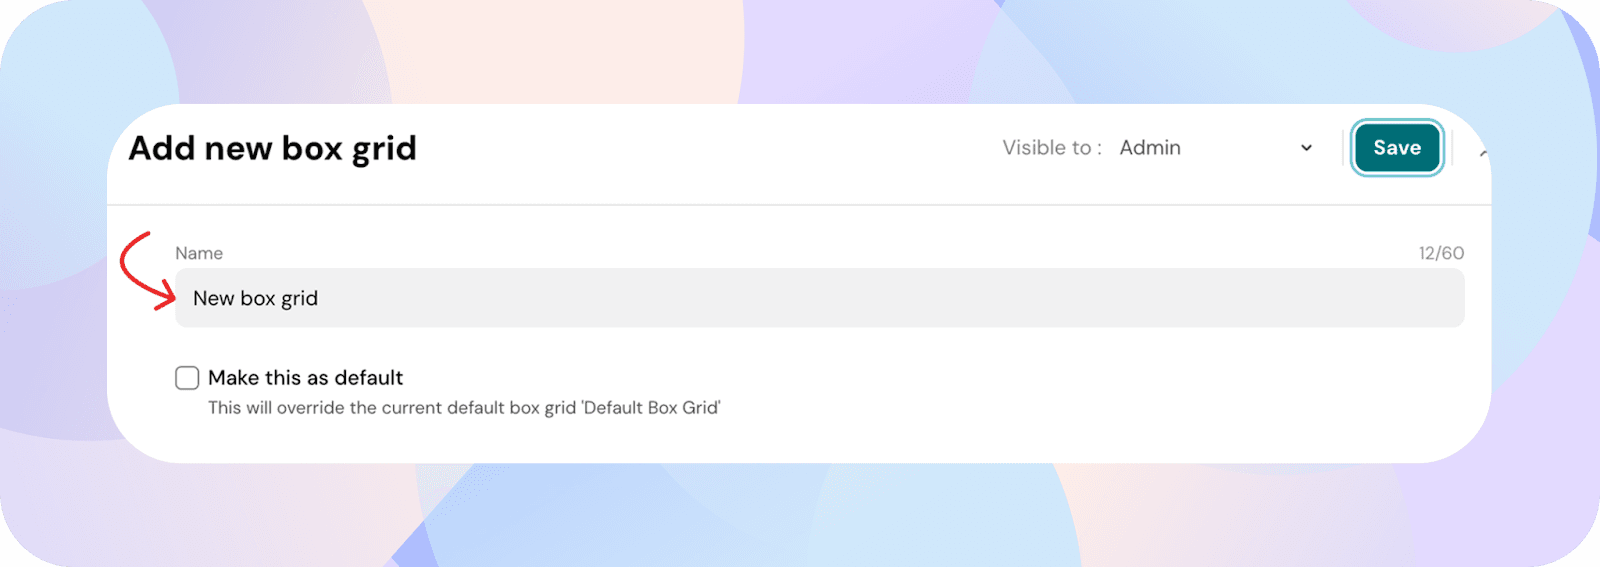
The Add new box grid panel will open.
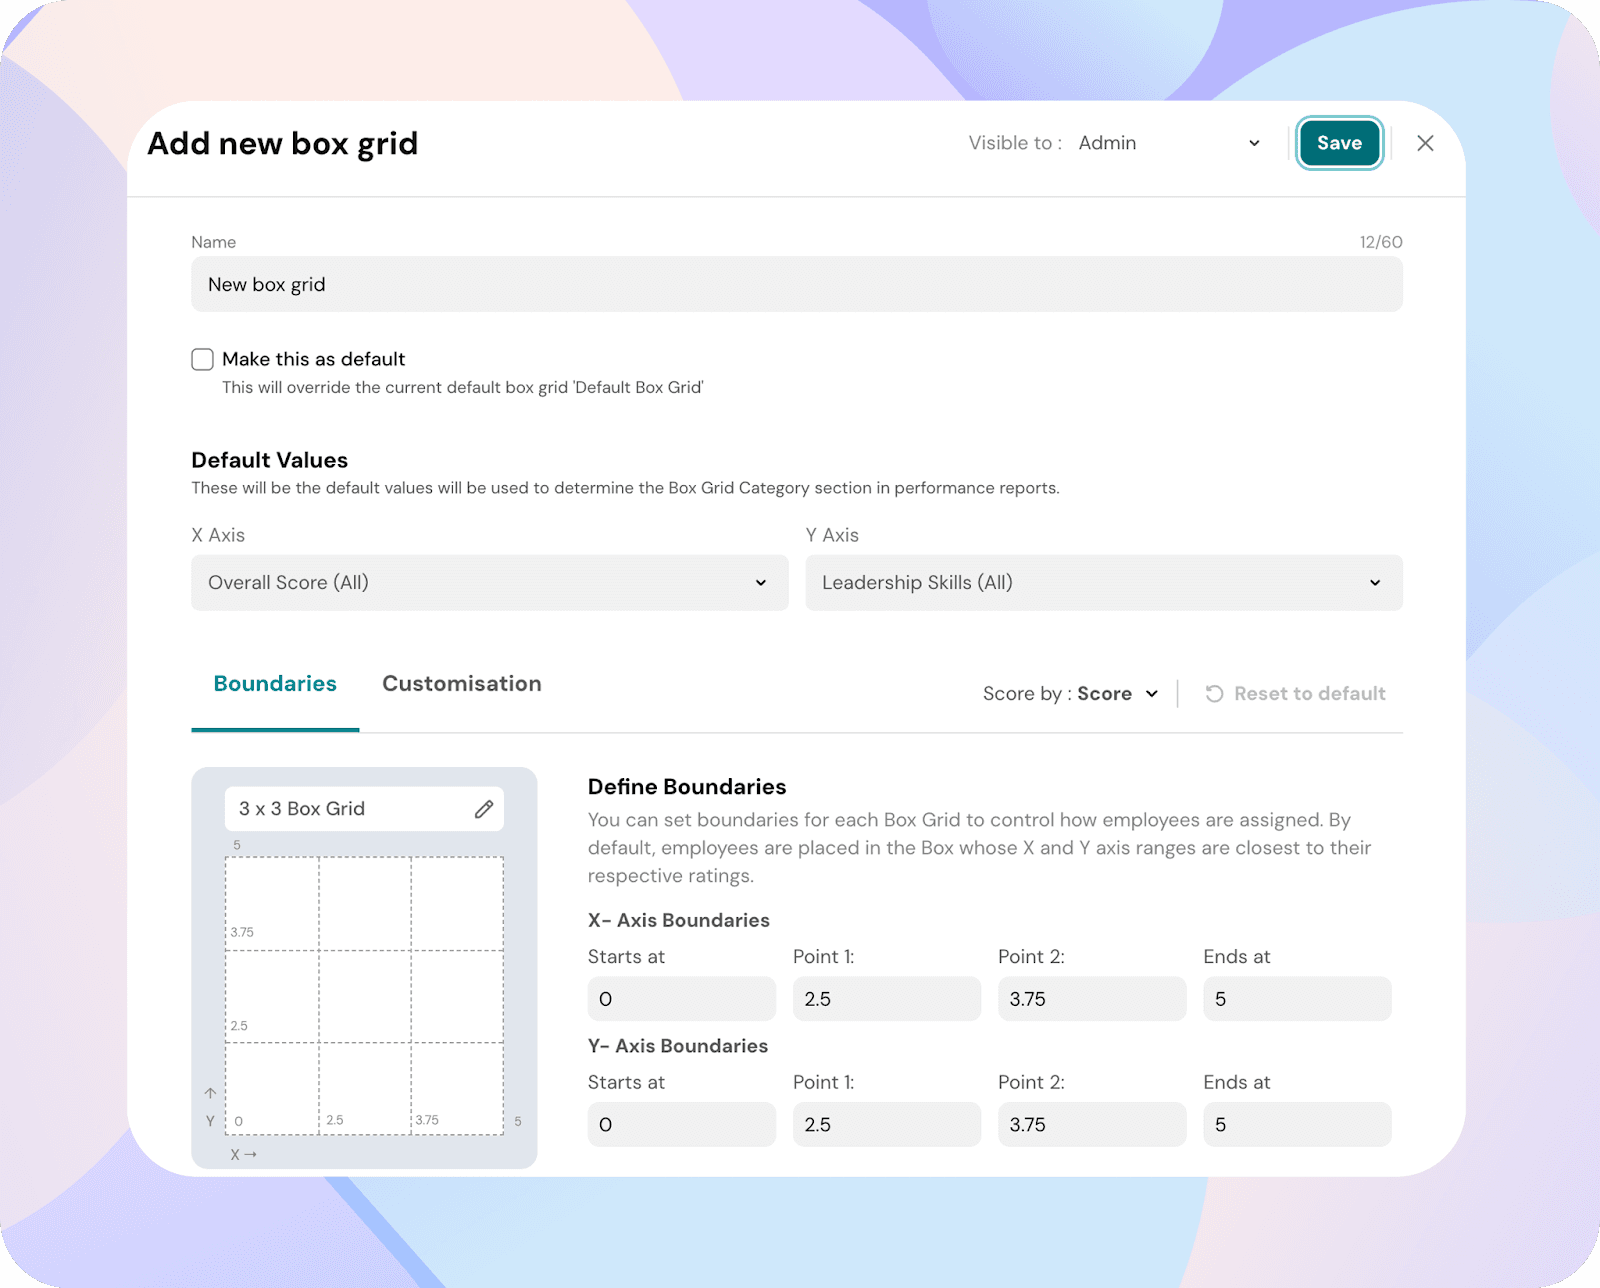
- Enter a name for your box grid.
Configure axes:
Set the X and Y axes to determine what data is plotted.
- Under Default Values, select the X Axis and Y Axis.
- Choose from the following options:
- Overall Score
- Competencies
- Specific Question
- Goal Score
- Goal Completion Percentage
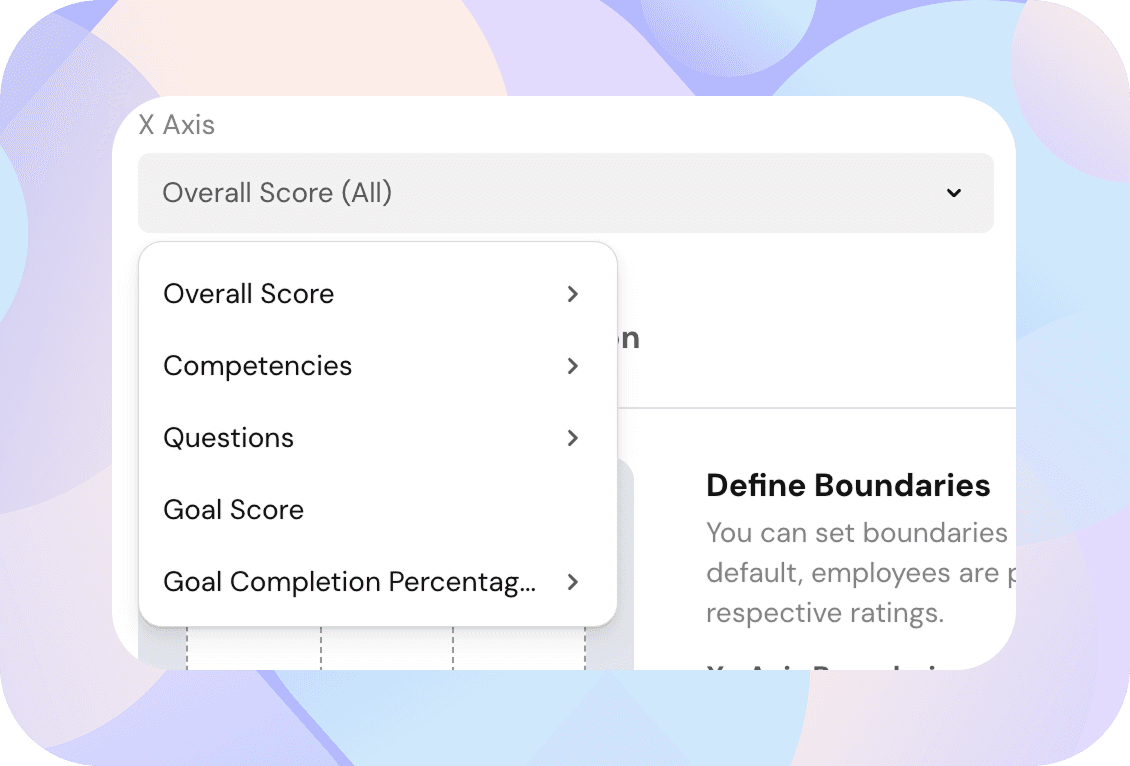
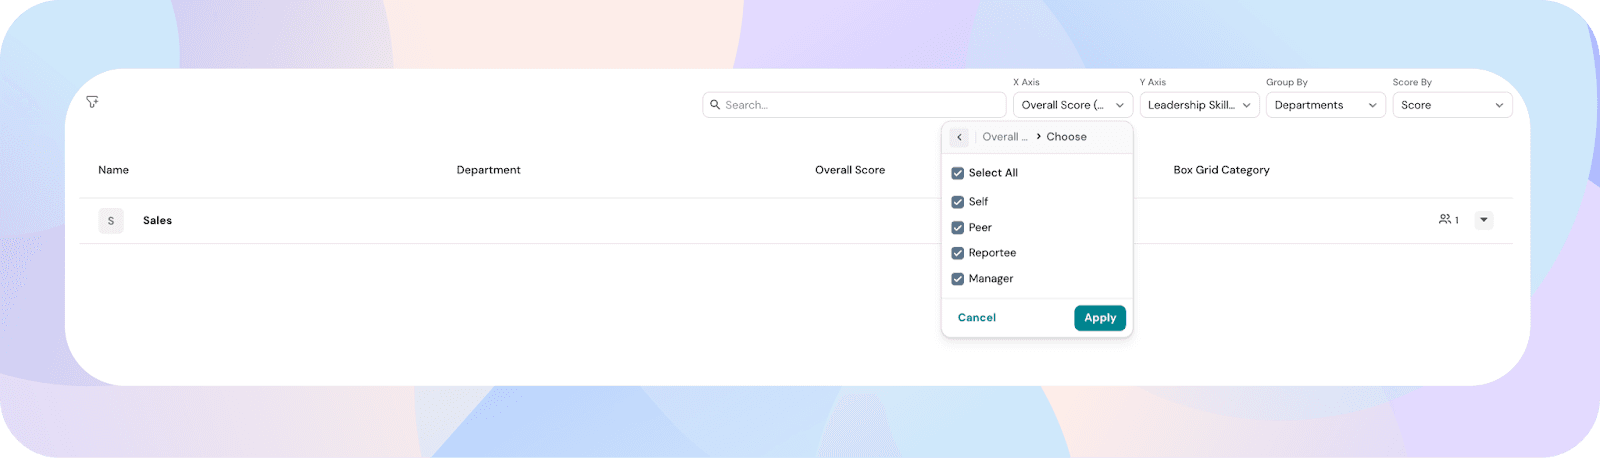
- For Overall Score and Competencies, you can choose reviewer types (for example, Manager or Reportee) to include in the calculation.
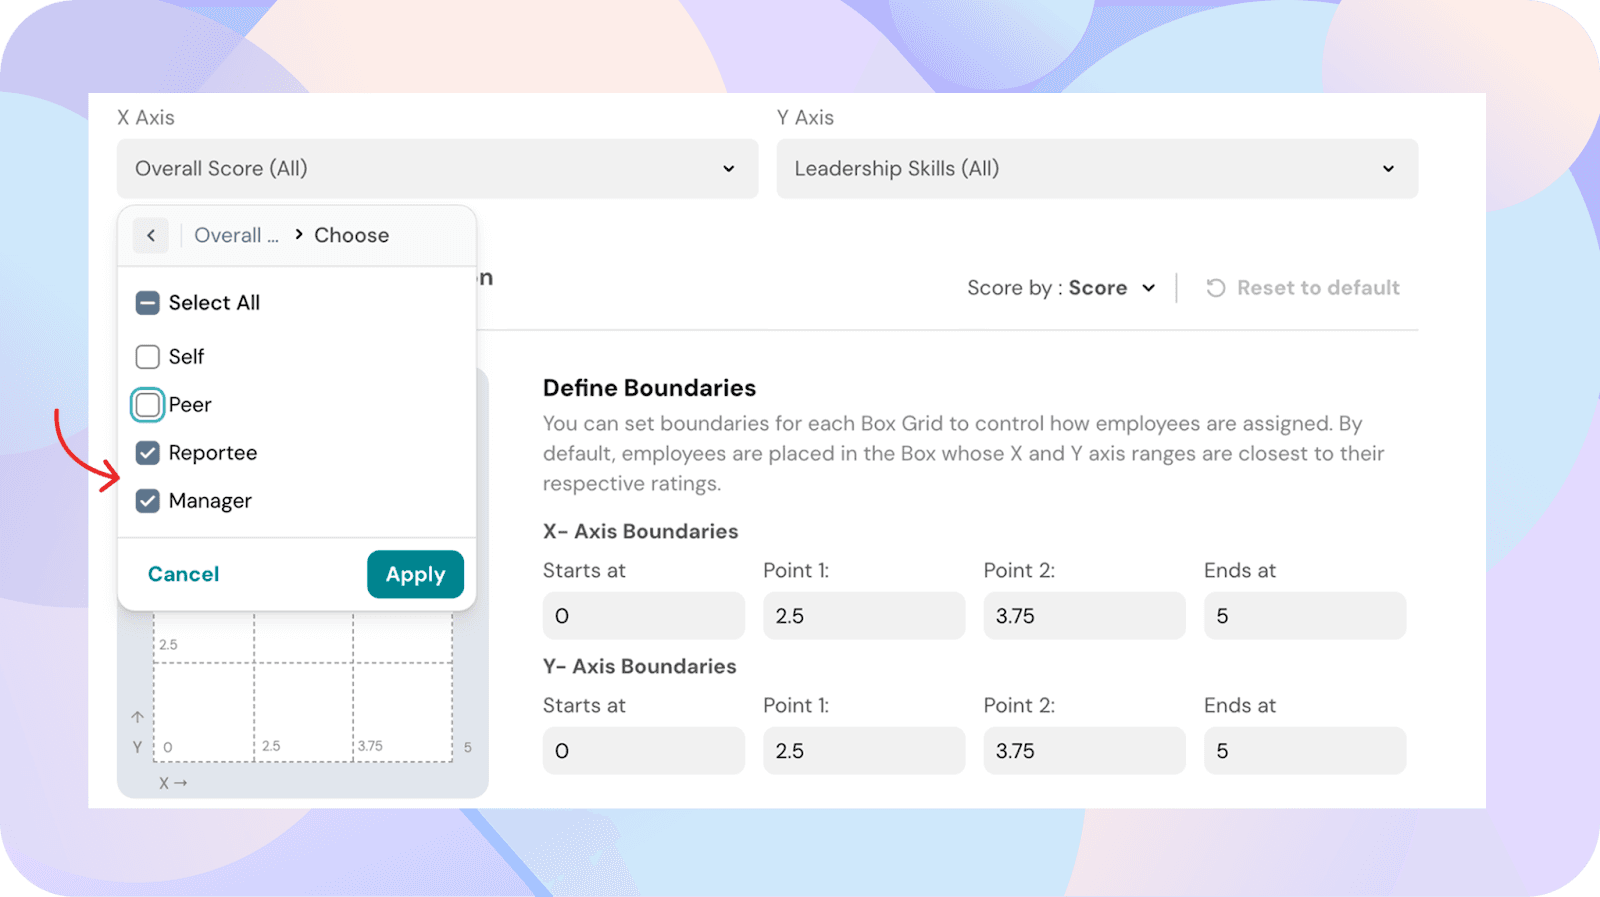
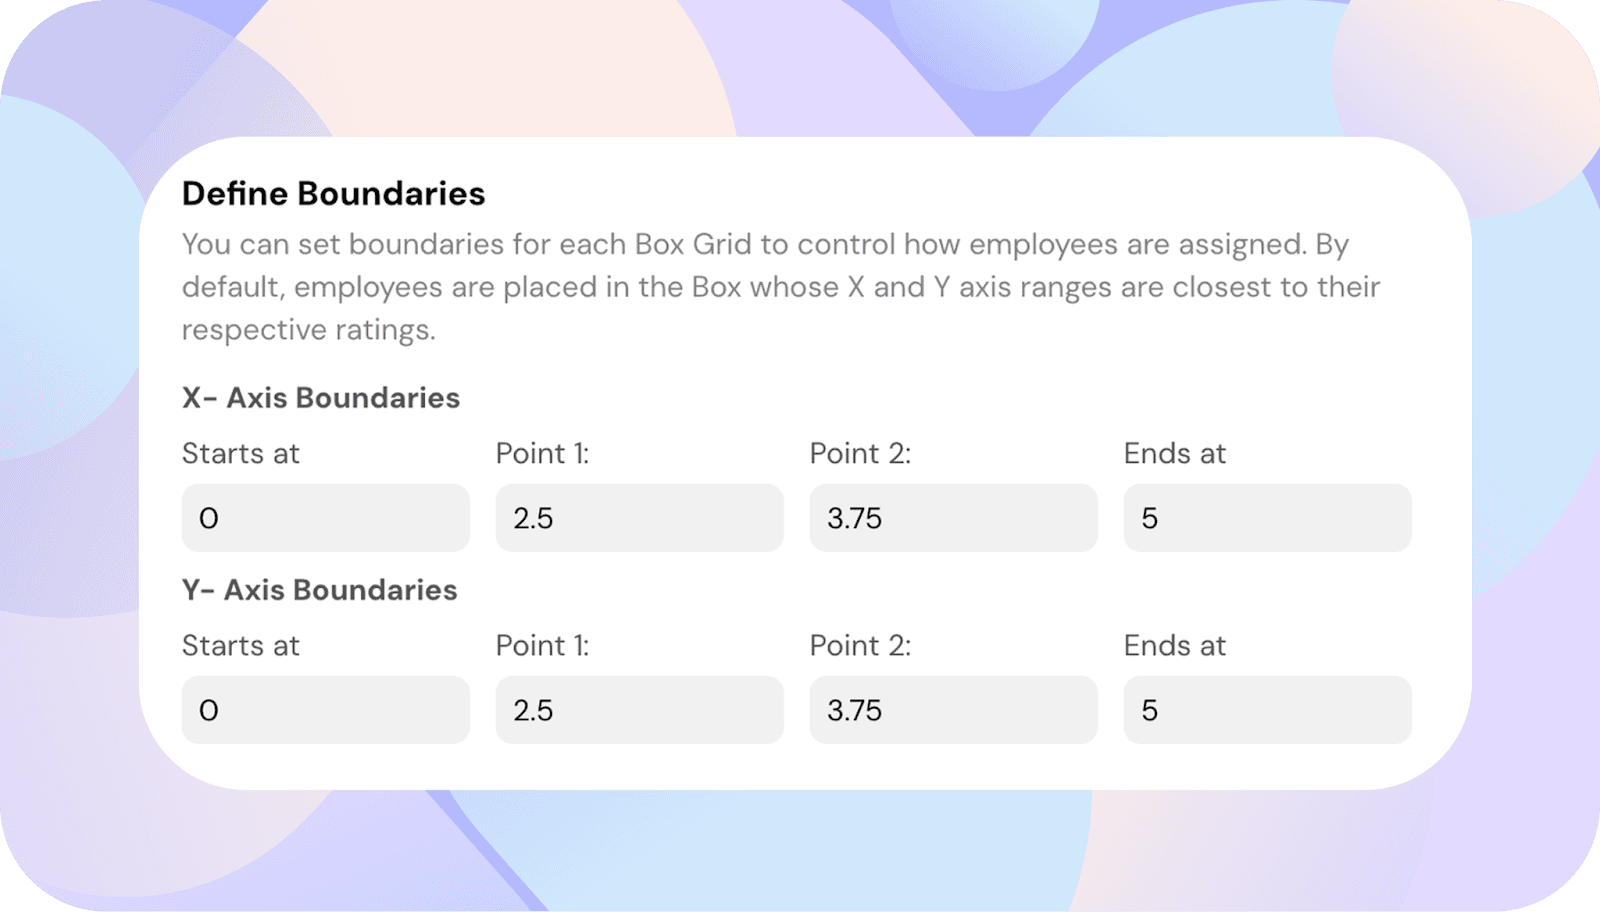
Define boundaries:
Boundaries determine how employees are distributed across the grid.
- Navigate to the Boundaries tab.
- Define the score ranges for each segment.
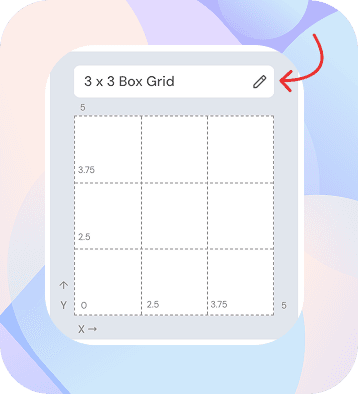
By default, the grid is set to a 3x3 layout (9 box grid).
- Click the pencil icon to change the grid size.
- Select a new layout (up to 10x10).
The grid does not need to be symmetric.
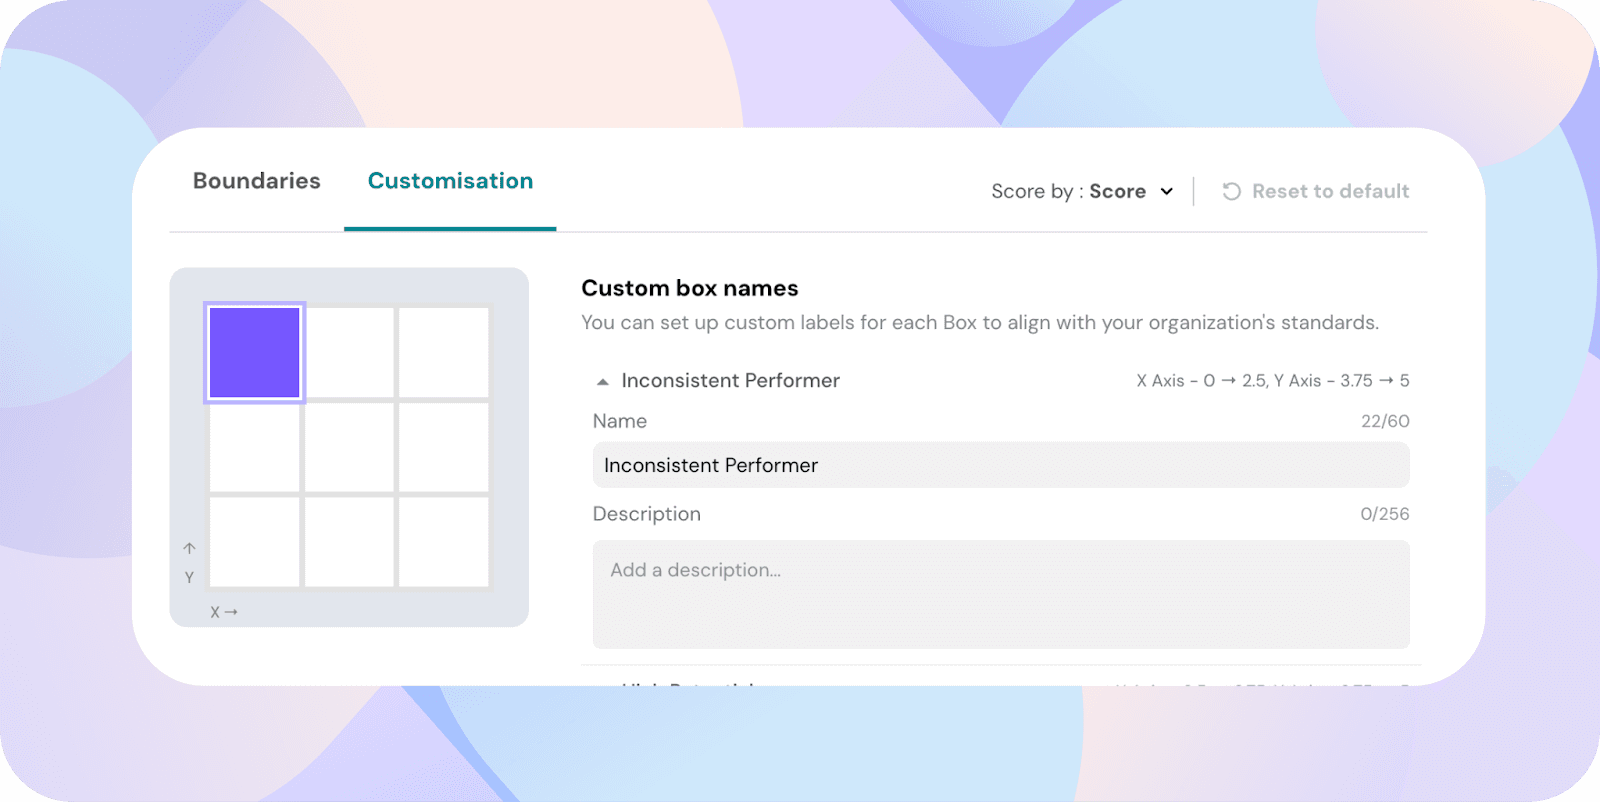
Customize grid labels:
You can label each box to make interpretation easier.
- Go to the Customisation tab.
- Add a name for each box.
- Optionally, add a description.
This helps users understand categories such as Future Leader or Needs Coaching.
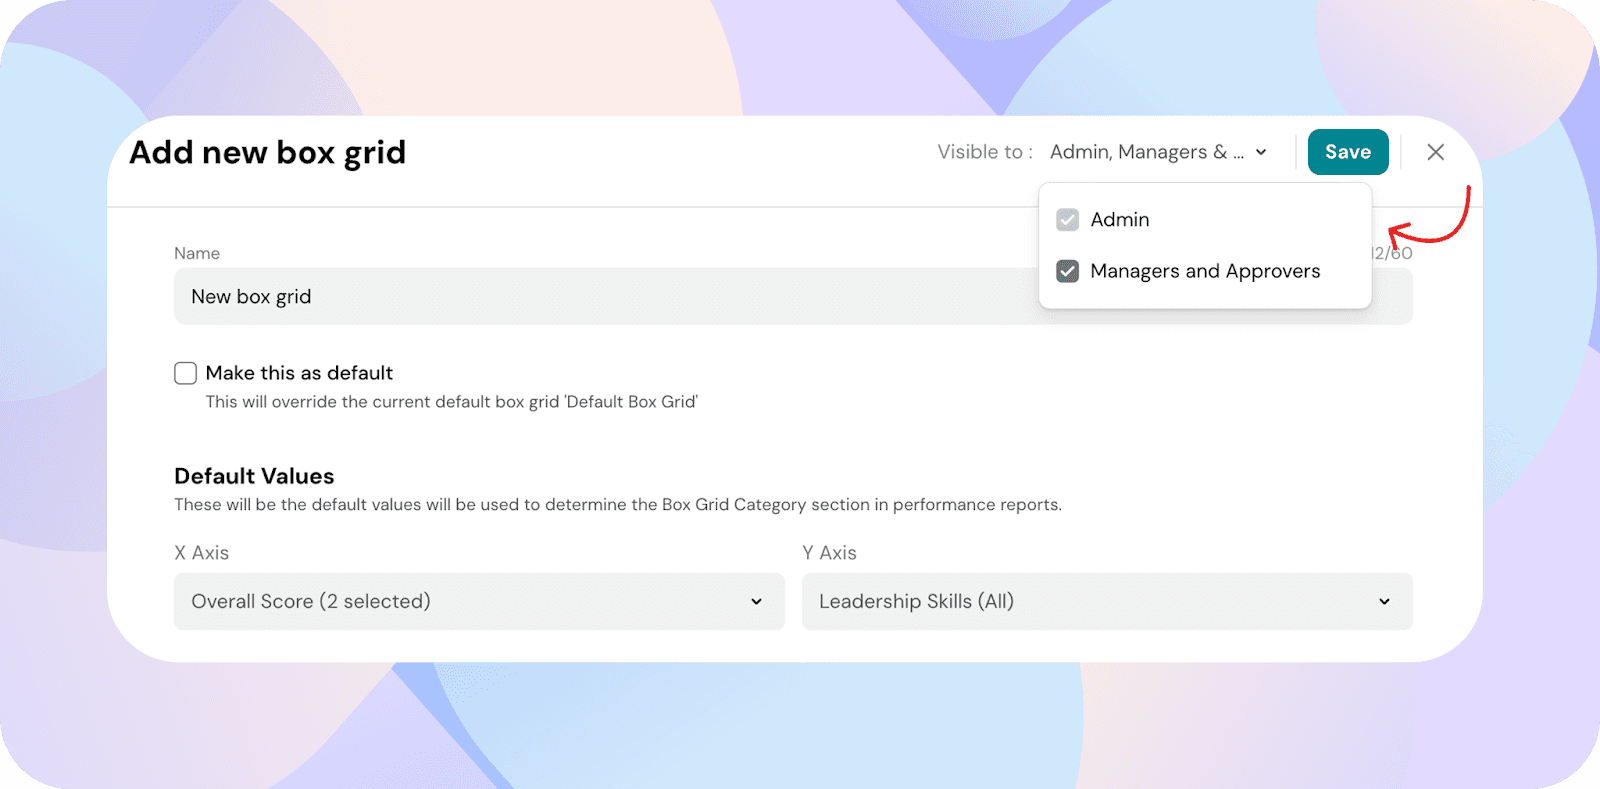
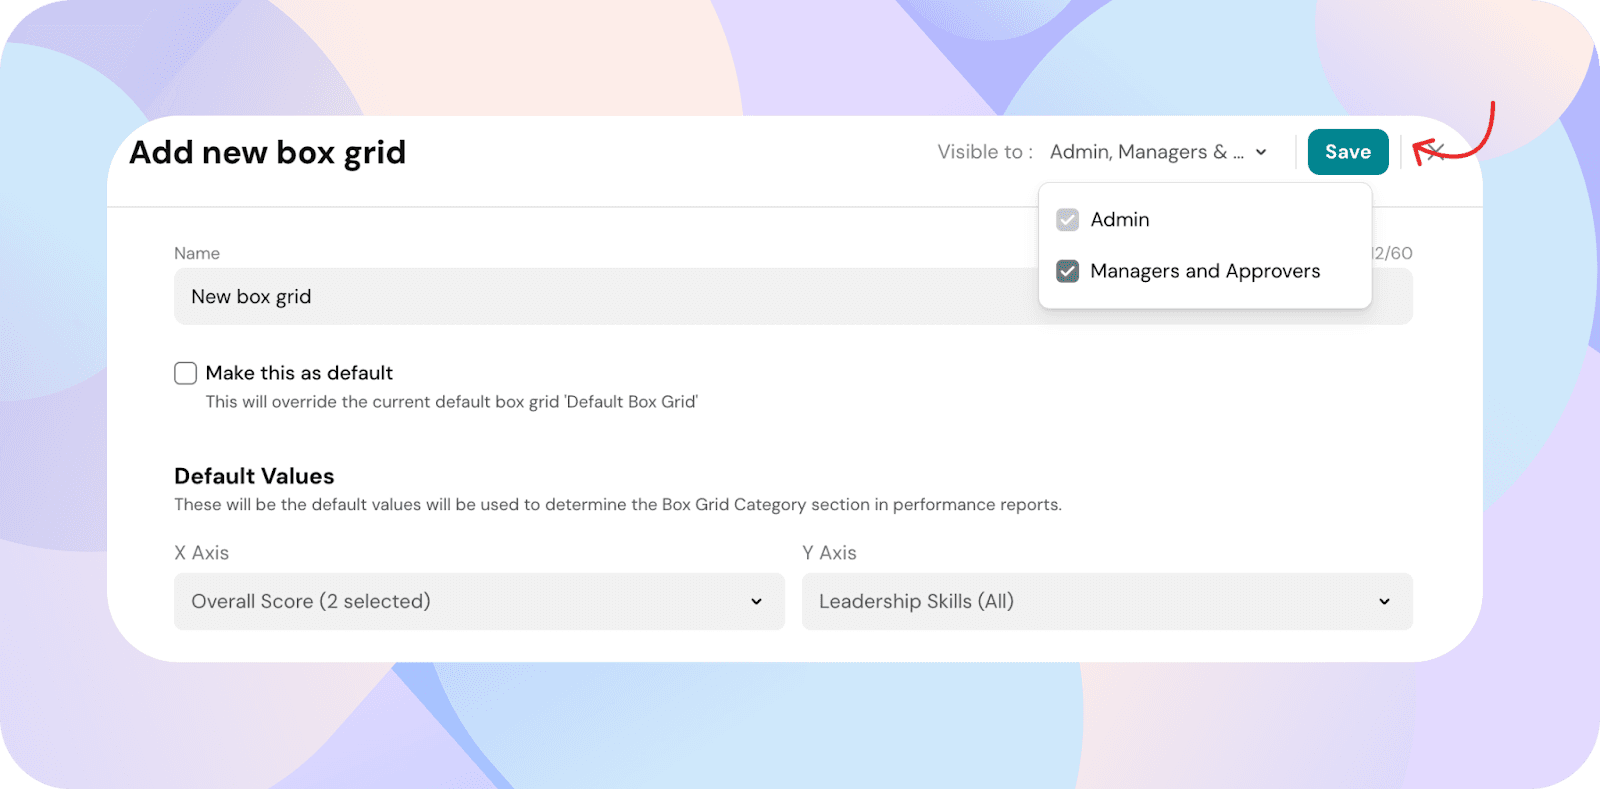
Set visibility:
Control who can access the box grid.
- Use the Visible to dropdown.
- Choose visibility:
- Admin only
- Managers
- Approvers
If enabled, the box grid will also appear in Team Analytics.
- Click Save to create the box grid.
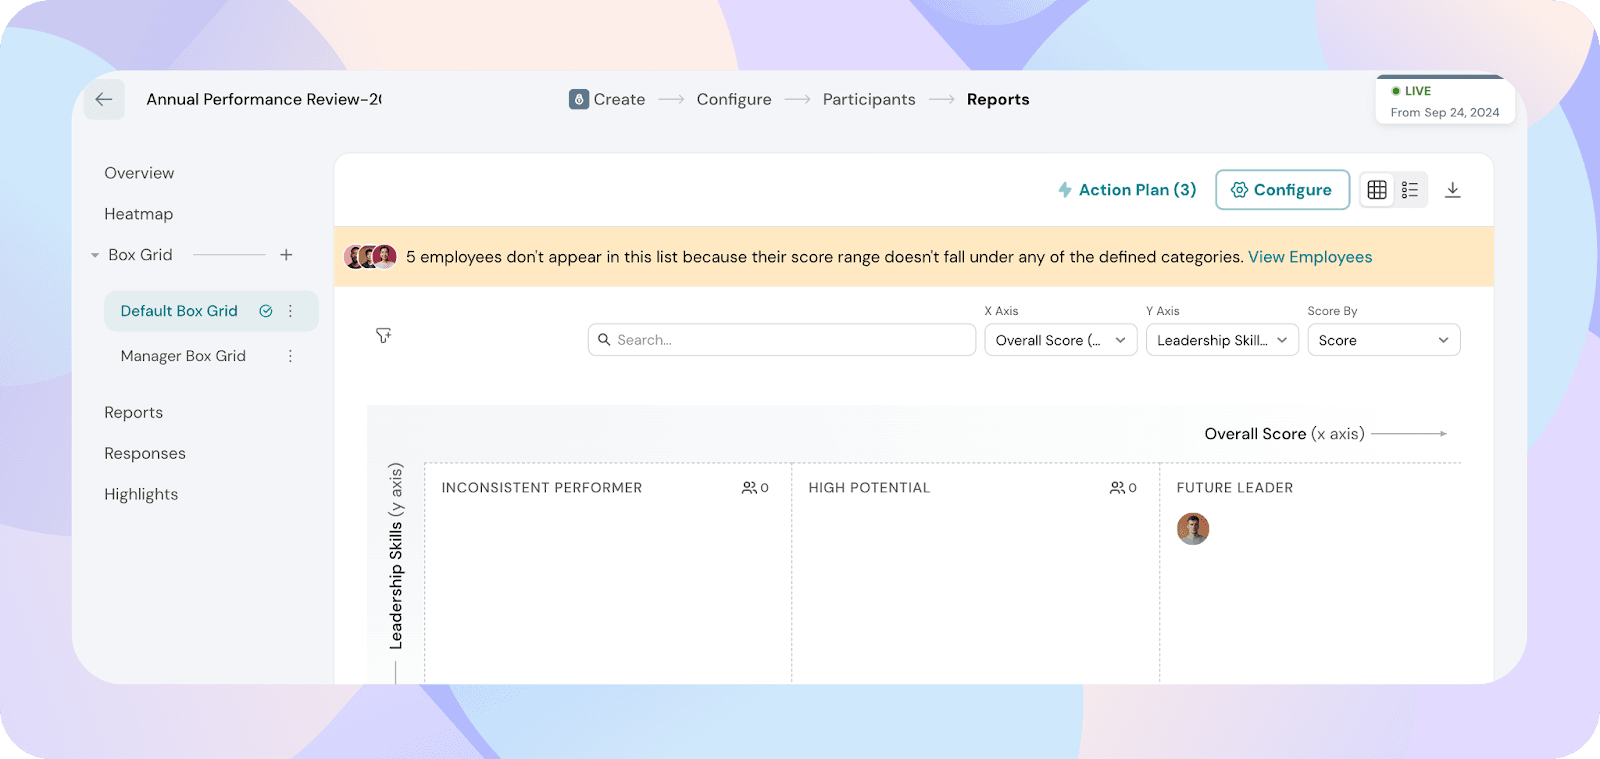
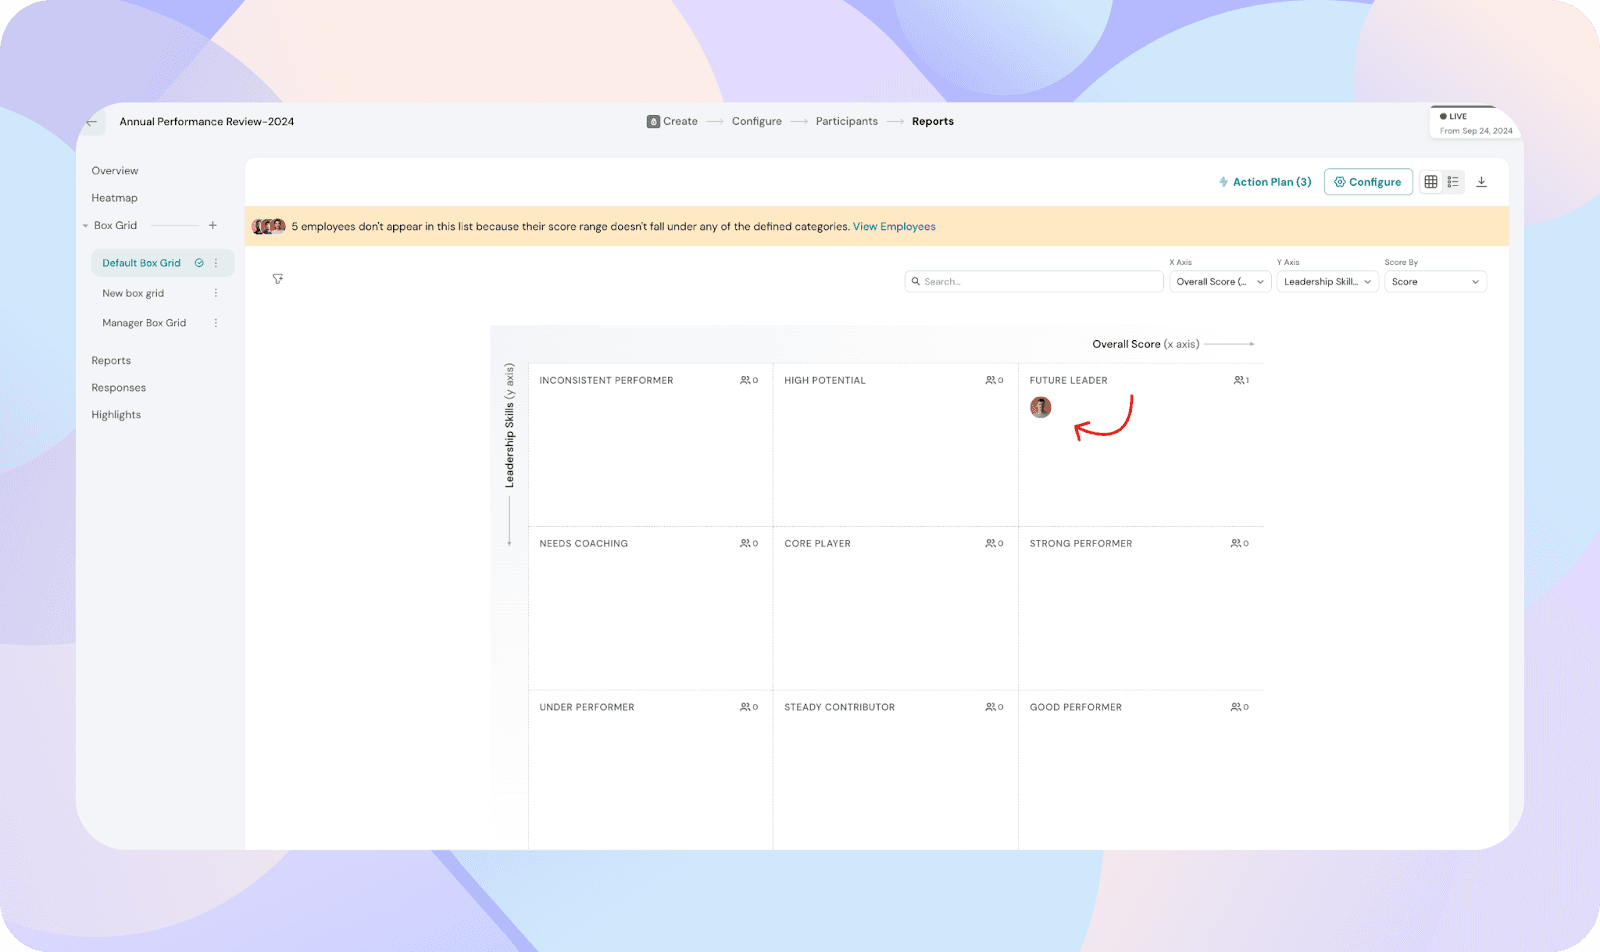
View people on a box grid:
You can view employees plotted based on their scores.
- Click a box grid name from the left sidebar.
- In grid view, employees appear as avatars within the relevant boxes.
Axis labels are displayed along the edges for clarity.
Search and filter employees:
You can refine what is displayed on the grid.
- Use the Search bar to find a specific employee.
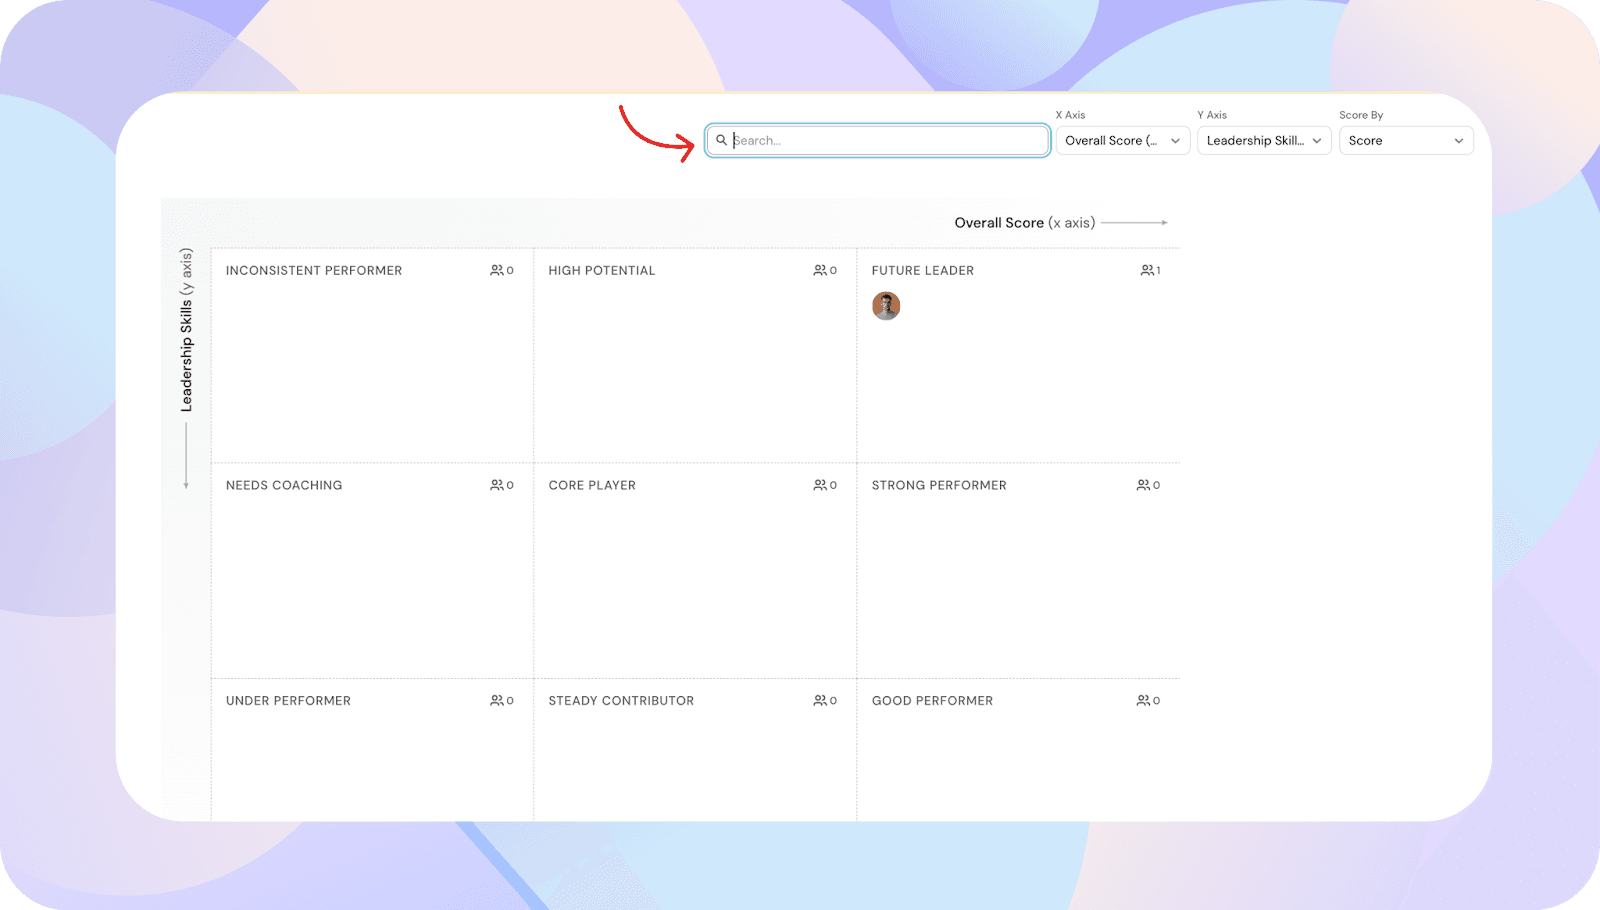
- Click the Filter icon to narrow results by department or role.
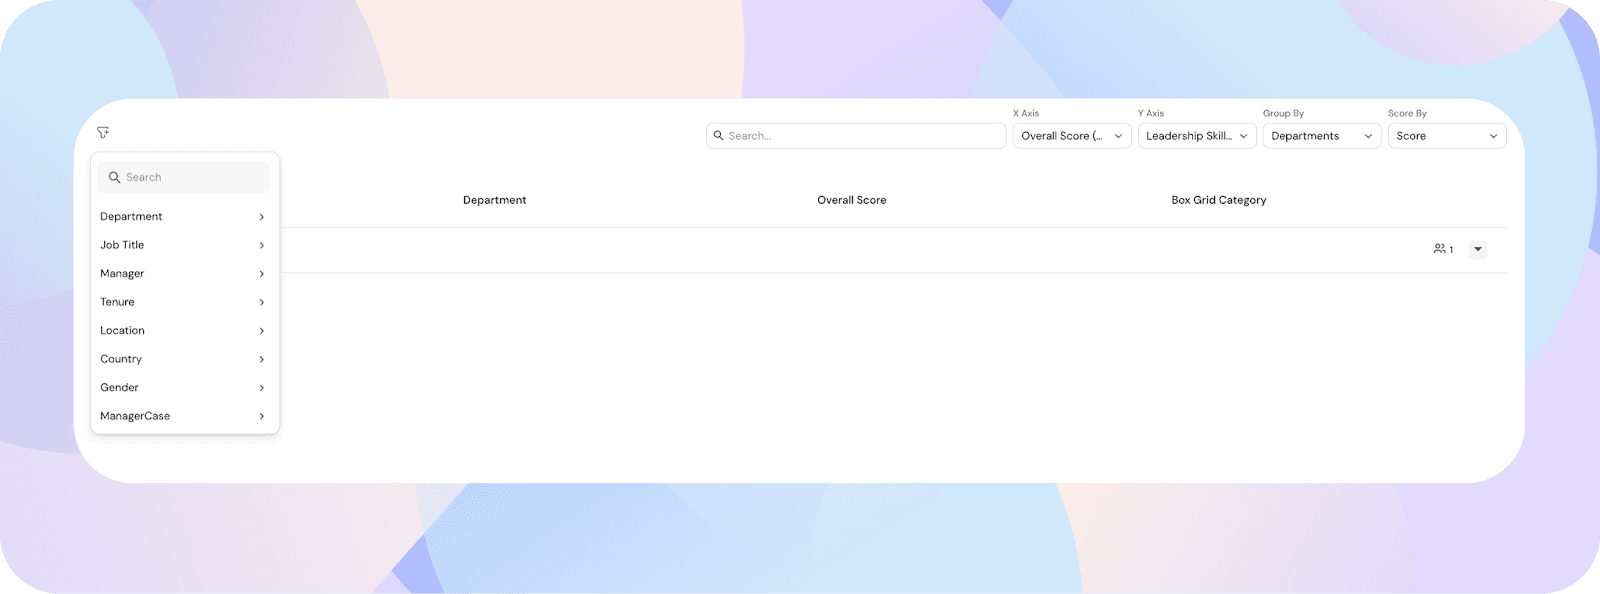
- Use the following dropdowns to adjust the view:
These changes do not affect the saved configuration.
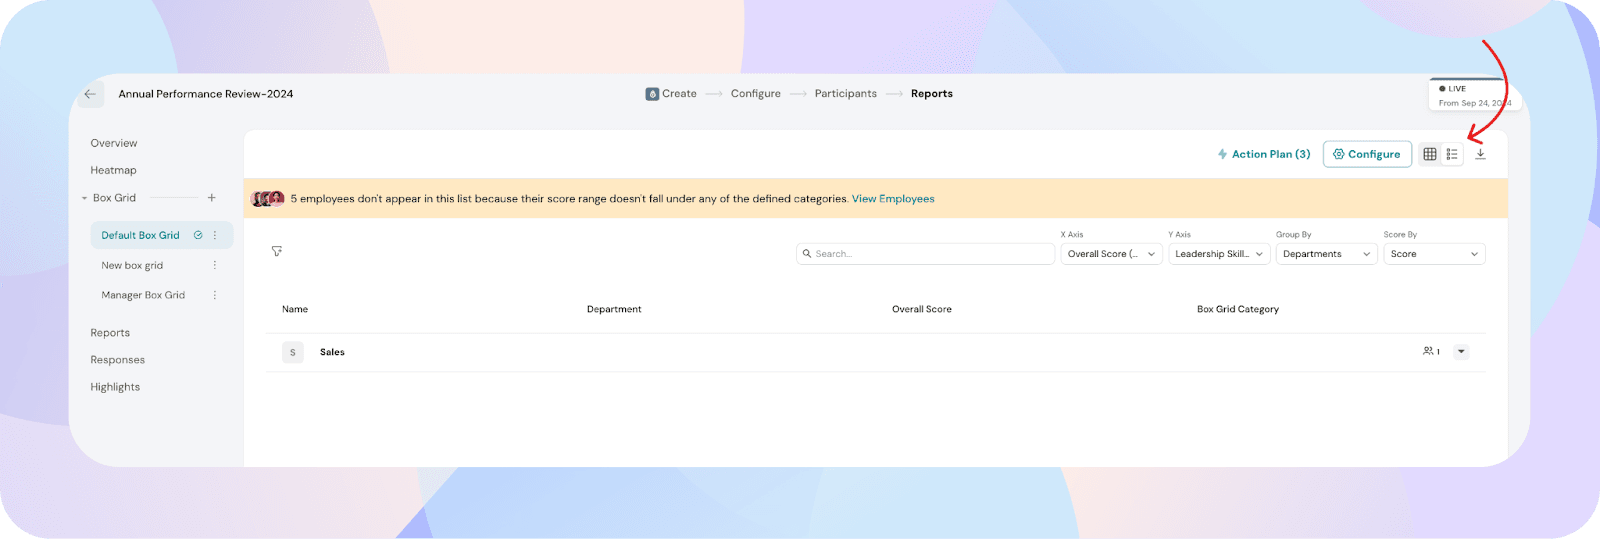
Switch to list view:
If you prefer a tabular format:
- Click the List view icon in the top-right corner.
This view shows:
- Employee name
- Department
- Score
- Box grid category
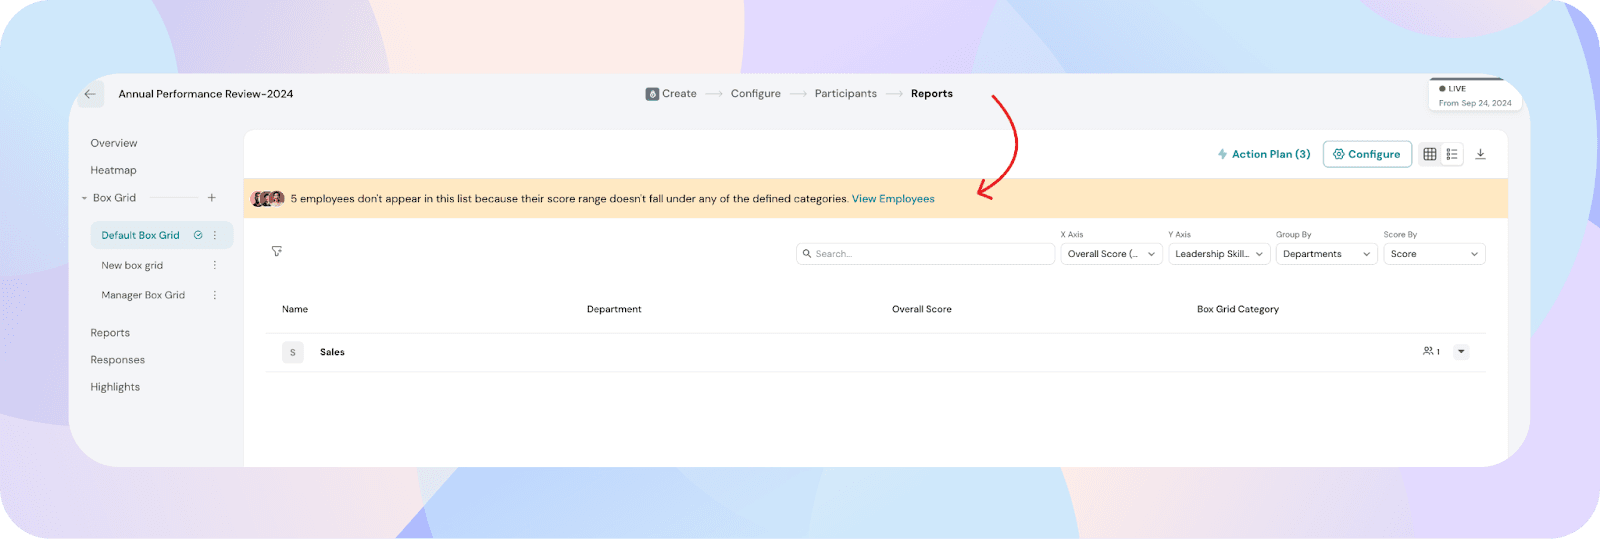
Employees not appearing on the grid:
Some employees may not appear on the grid.
- A banner will indicate if employees are excluded.
- Click View Employees to see the list.
This typically happens when:
- Employees were not reviewed
- Their scores do not fall within defined boundaries
Recomputation after changes:
Box grid data is automatically recalculated when changes are made.
- Any updates to:
will trigger recomputation.
- For larger organizations, this may take 2–5 minutes.
- A loading state will be displayed during this time.
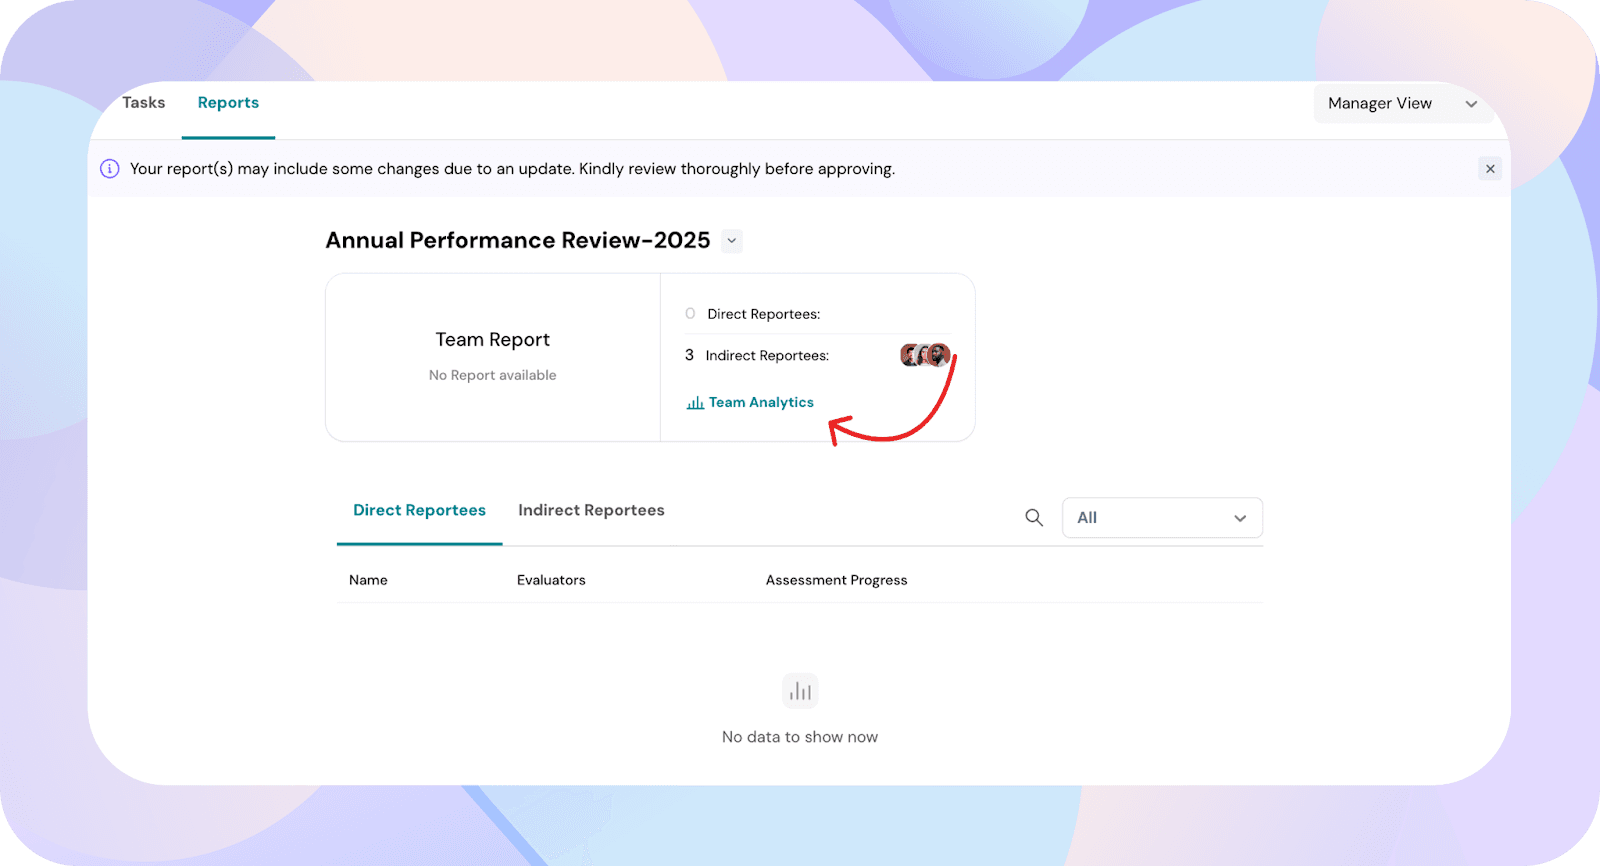
Access box grid in team analytics:
If visibility includes Managers or Approvers, they can access the box grid in Team Analytics.
- Go to Employee View
- Navigate to Performance
- Click Reports
- Select the relevant survey
- Click Team Analytics
The box grid will be available for viewing.
Managers and approvers can also create their own box grids from Team Analytics.
Note: Box grids created by managers or approvers are private and cannot be shared.
If you have any questions or need assistance, please feel free to reach out to our support team.