The Goals Analytics – Employee View in ThriveSparrow gives you a snapshot of your own goals, their current progress, and how they are tracking within the selected cycle. This view is designed to help you stay on top of your goals and spot where you need to take action.
Key Sections in Employee Analytics
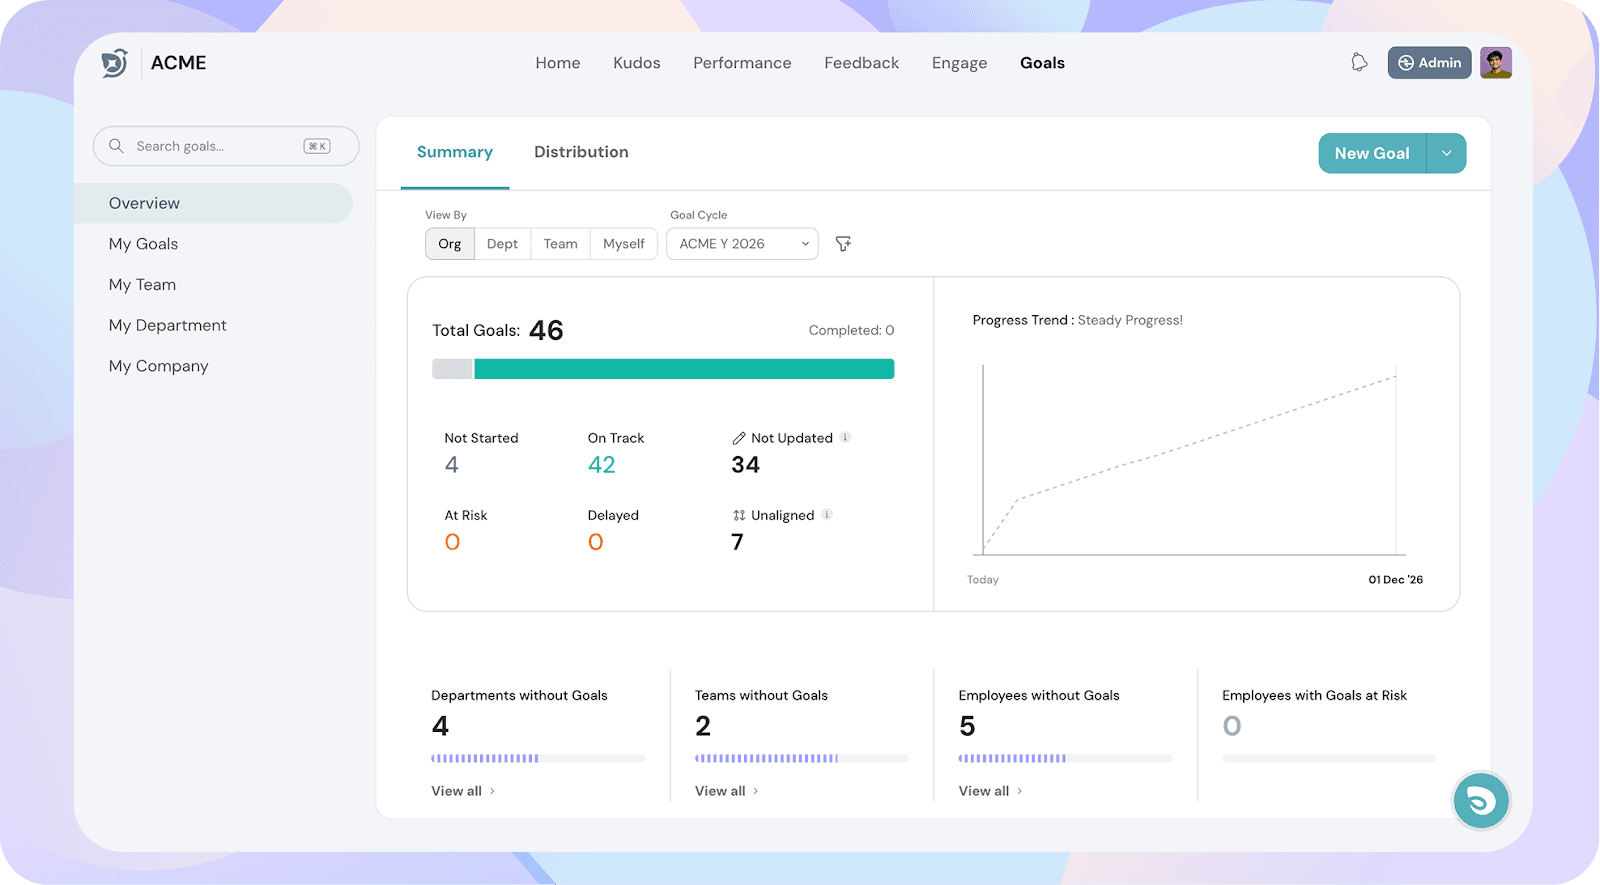
1. Total Goals and Progress Status
Total Goals – The number of goals you’ve created in the selected cycle.
Completed Goals – The number of goals you’ve marked as complete.
Status Breakdown:
Not Started – Goals that haven’t been updated yet.
On Track – Goals progressing as expected.
At Risk – Goals that might miss deadlines or milestones.
Delayed – Goals already behind schedule.
Not Updated – Goals without any recent check-ins.
Unaligned – Goals not linked to a parent or higher-level goal.
Tip: If you see “Not Updated” or “Unaligned,” it’s a good reminder to update your progress or align your goal to a parent one.
2. Progress Trend
On the right, you’ll see a graph that shows how your progress is trending over time:
Green line – Your actual progress.
Dashed line – The expected or planned progress.
If your line is below the expected trend, it’s a signal to take action early.
For individual contributors, these sections may often just reflect your own data.
4. Filters
At the top, you can:
Switch Goal Cycles – Compare your progress across different cycles.
Apply Filters – If your HR admin has set up filters(like job role or location), you can filter your goals accordingly.
Best Practices for Employees
Update regularly – Keep your goals marked “On Track” by posting check-ins.
Address risks early – If something is slipping, update the status to “At Risk” and flag it in comments.
Align goals – Avoid “Unaligned” status by connecting your goal to a team or organizational objective
Compare progress – Use the progress trend chart to see if you’re pacing as expected.