The Goals Analytics page in ThriveSparrow gives you a comprehensive snapshot of your organization’s goal progress. It helps you track alignment, identify risks, and monitor overall performance across teams, departments, and individuals.
Key Sections in the Analytics Page
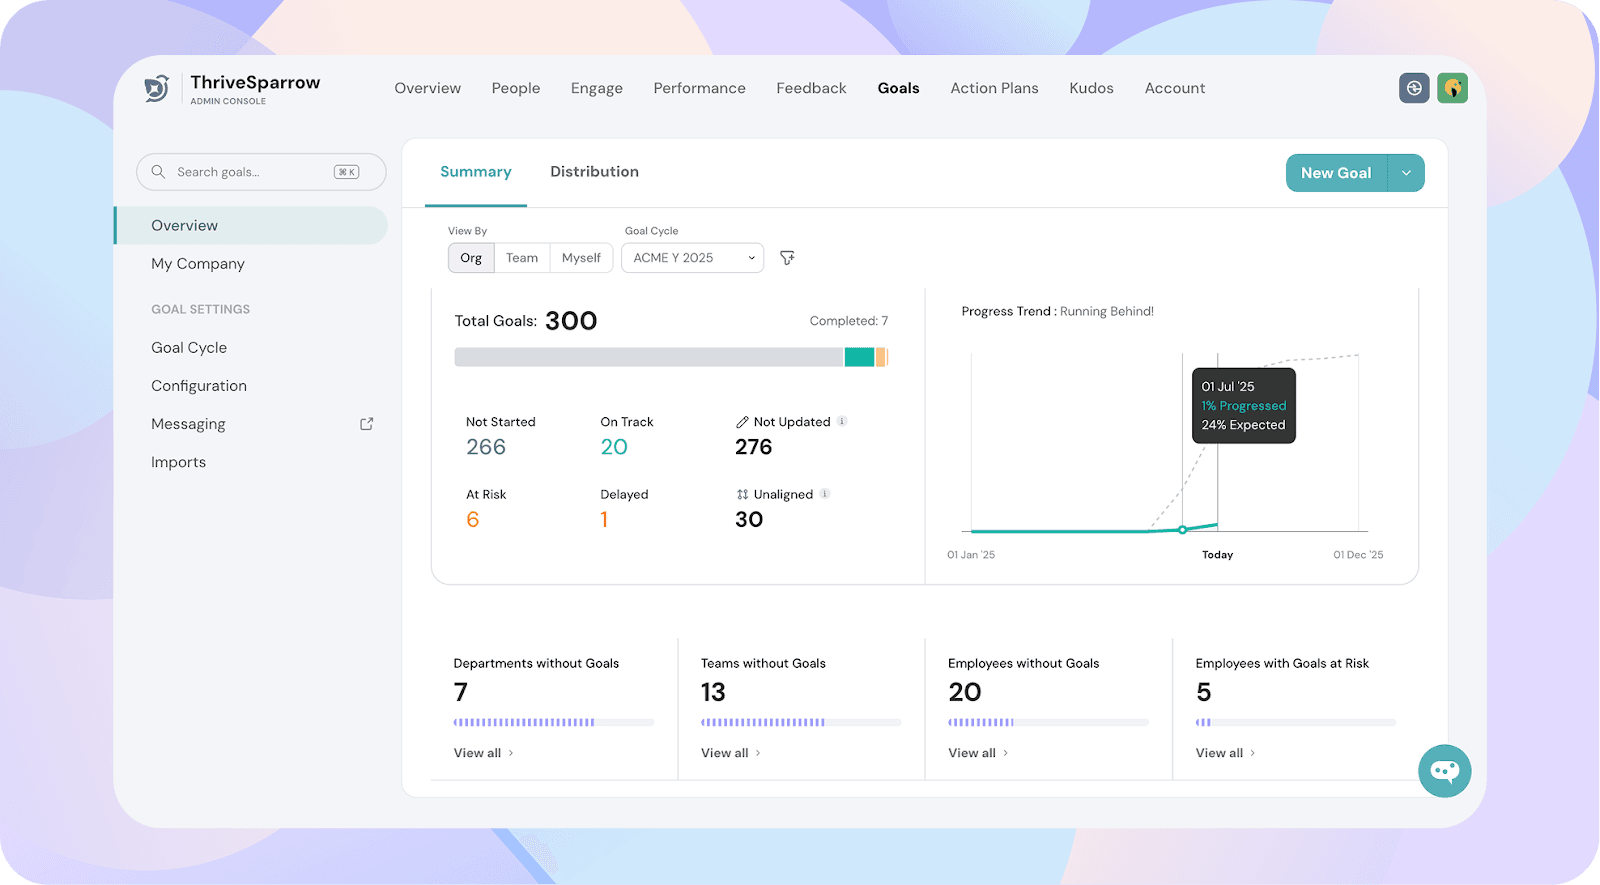
When you navigate to Goals → Overview, the Summary tab displays all key metrics for the selected goal cycle.
1. Total Goals and Progress Status
Total Goals: The total number of goals created in the selected cycle.
Completed Goals: Number of goals that have been marked as completed.
Goal Status Breakdown:
Not Started – Goals with no updates yet.
On Track – Goals progressing according to plan.
At Risk – Goals that might miss deadlines or are behind expected progress.
Delayed – Goals already behind schedule.
Not Updated – Goals without any recent updates.
Unaligned – Goals not linked to any parent or organizational goal.
2. Progress Trend
A visual graph showing how goals are progressing over time.
Green line: Actual progress trend.
Dashed line: Expected or planned progress trend.
This chart quickly highlights if your organization is running behind or on track.
3. Goal Coverage Metrics
Departments without Goals – Count of departments that have department level goals.
Teams without Goals – Number of teams currently without any team level goals.
Employees without Goals – Employees who don’t have any goals assigned to them.
Employees with Goals at Risk – Employees with one or more at-risk goals.
Tip:
Clicking on any metric provides a drilled-down view of the underlying data.
For example:
Clicking Employees without Goals displays a list of all employees who currently don’t have any goals.
Clicking Delayed shows all the goals that have been delayed.
This helps you identify gaps quickly and take corrective actions immediately.
Filtering Your Analytics
View By: Toggle between Org, Team, or Myself to see data from different perspectives.
View Options in Goals Analytics
The View By filter in Goals Analytics allows you to see goal data from different perspectives:
Org – View the overall organization-wide goal data.
Department – View goals for your department.
Team – View goals for your team.
Myself – View only your personal goals.
Example
You are a Manager with 5 direct reportees and 3 indirect reportees:
You will see the Team tab in Analytics.
Within the Team view, you can toggle between:
All – Combined view of direct and indirect reportees
Direct – Only your immediate reportees
Indirect – Skip-level or indirect reportees
You are a Department Head for Marketing:
You will see the Department tab in Analytics.
This tab will show all goals owned by employees in the Marketing department.
This ensures every user sees the most relevant goal data for their scope of responsibility.
This ensures you always get the most relevant view for your role.
Goal Cycle: Switch between goal cycles to compare progress across periods.
Filters: Apply filters to narrow down to specific departments, teams, or individuals etc. You can also use any dropdown custom property provided you have set them up in the people directory.
Best Practices
Check the Progress Trend regularly to spot early signs of delays.
Address “Unaligned” and “At Risk” goals promptly to ensure organization-wide alignment.
Review departments or teams without goals to encourage participation in goal-setting.