Search
Performance Highlights help you uncover key patterns in how high and low performers differ — by using AI to analyze responses at a competency and question level. Instead of manually sifting through responses, you get an instant, visual summary of strengths, gaps, and drivers of performance generated by AI without any hassle— enabling you to focus on what needs attention and take targeted action.
With performance highlights, you can:
Infer AI will generate an automatic summary of insights based on high and low performer data within that review.The report offers two views: Compact View and Detailed View.
To switch between the compact and detailed view, click on the dropdown and select the desired one.
The Compact View displays the default report with concise text and visual graphs, while the Detailed View provides a comprehensive breakdown of each graph, offering in-depth insights.
The first time you access the report, Infer AI auto-generates highlights with the following defaults:
Performance highlights are always driven by employee performance ratings — meaning AI identifies patterns based on how top and low performers have responded to different questions and competencies.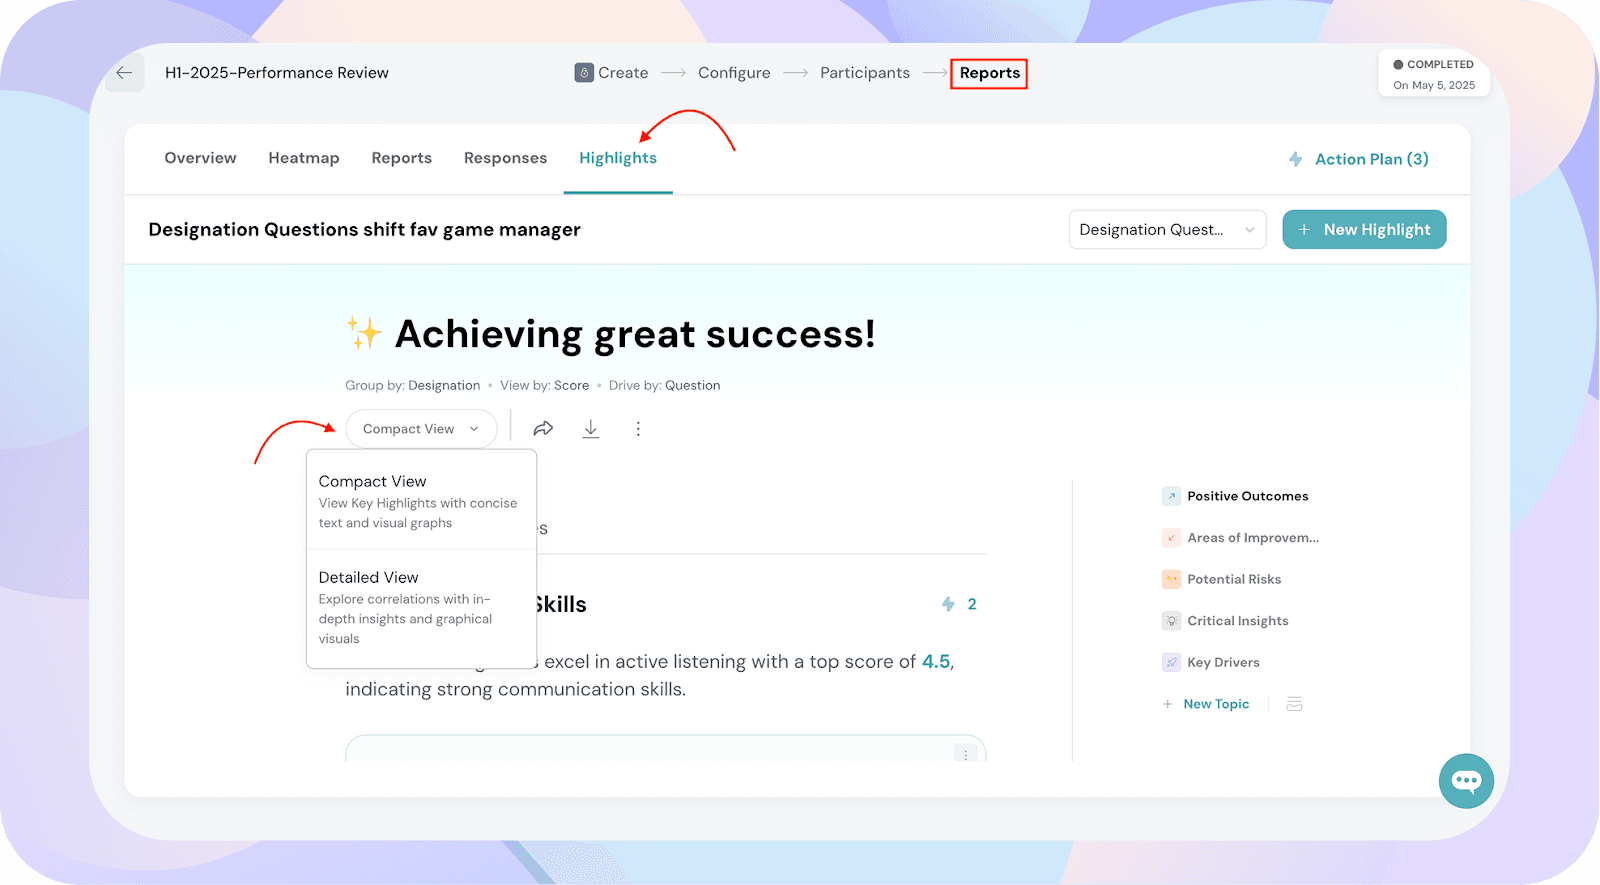
Key Sections in Performance Highlights
Each highlight section is built by comparing trends across high vs. low performers:
To customize your own highlight set:
Click New Highlight in the top right.
In the Choose Settings tab:
(Optional) Apply filters for more focused reports
Click Continue
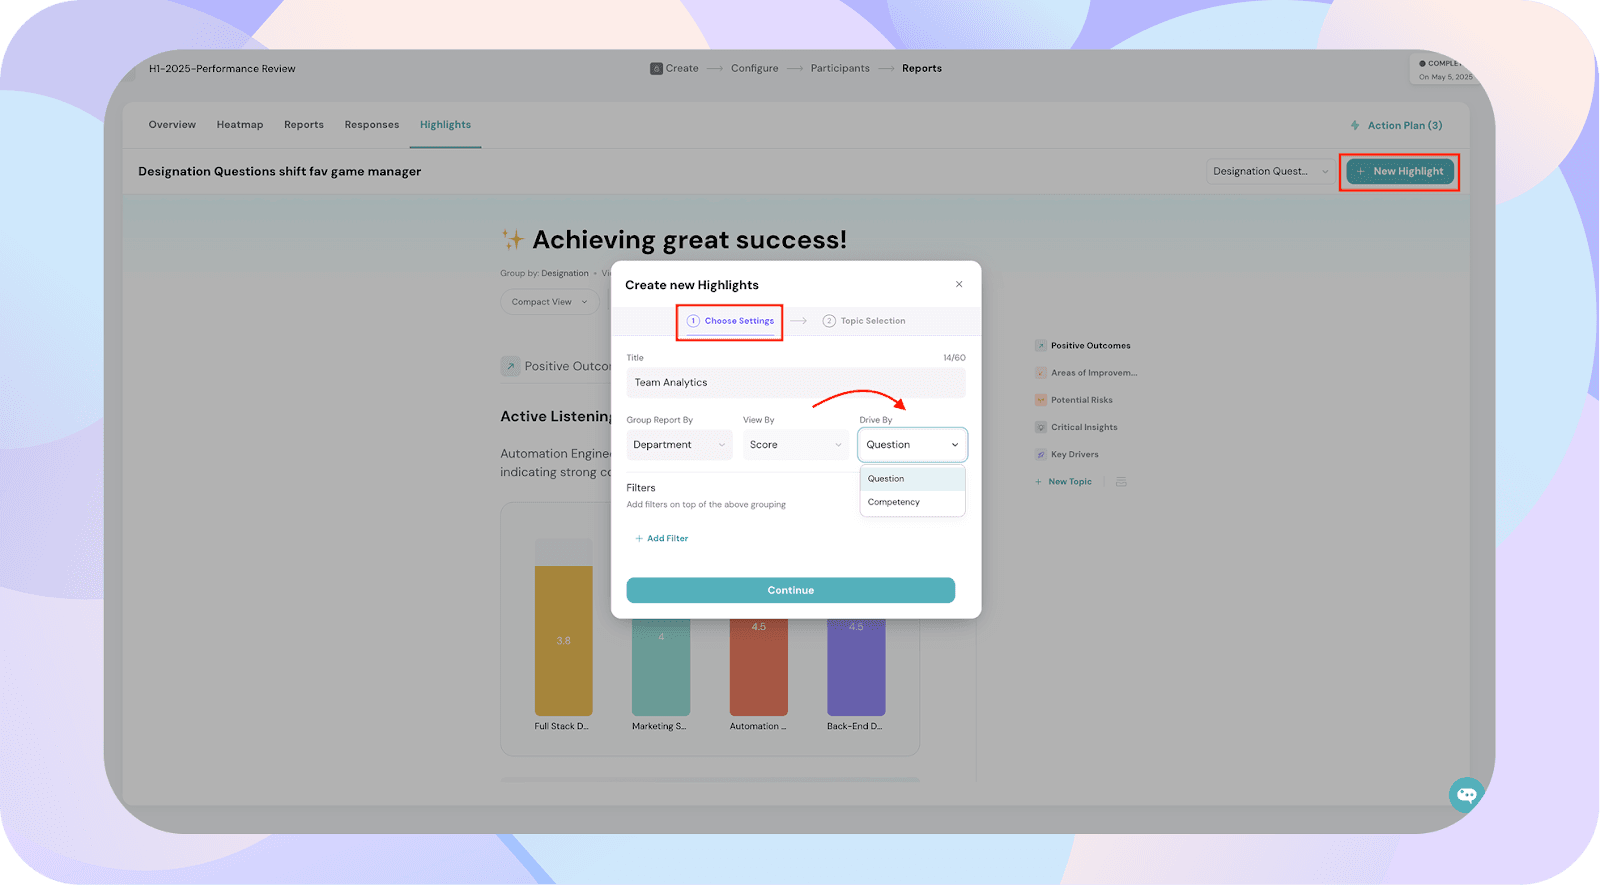
When you choose Drive By: Competency, Infer AI groups feedback under key skill clusters (like Collaboration, Decision-Making, or Communication). This helps you quickly understand performance at a macro level.
When you choose Drive By: Question, you get deeper, question-specific insights — useful for targeted coaching.
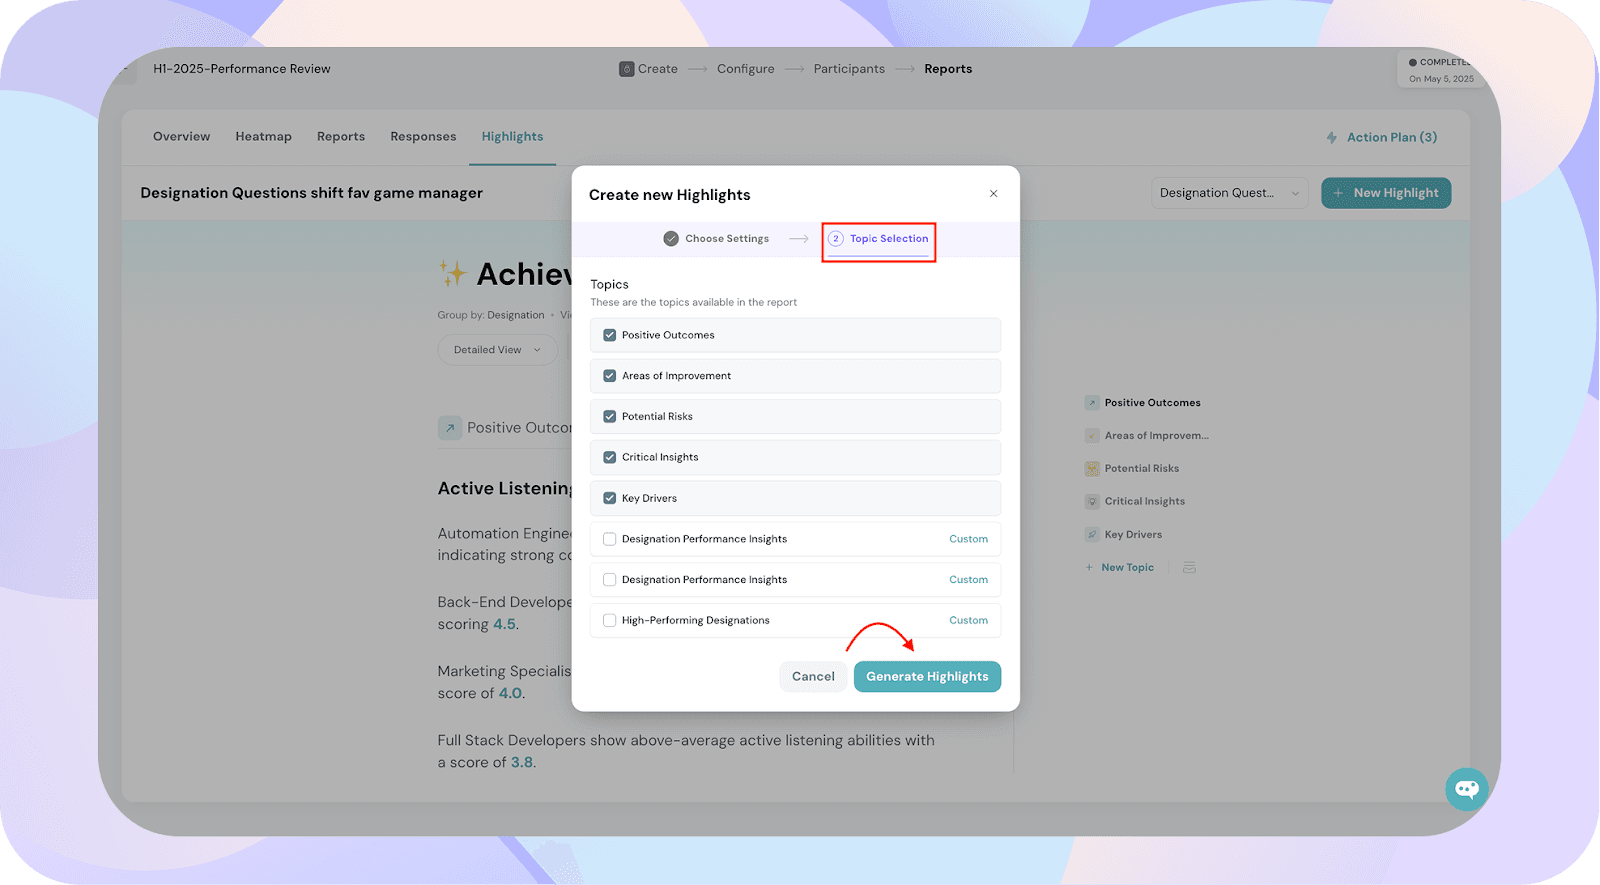
Then, in Topic Selection:
Your new report will reflect these settings and appear under the Highlights tab.
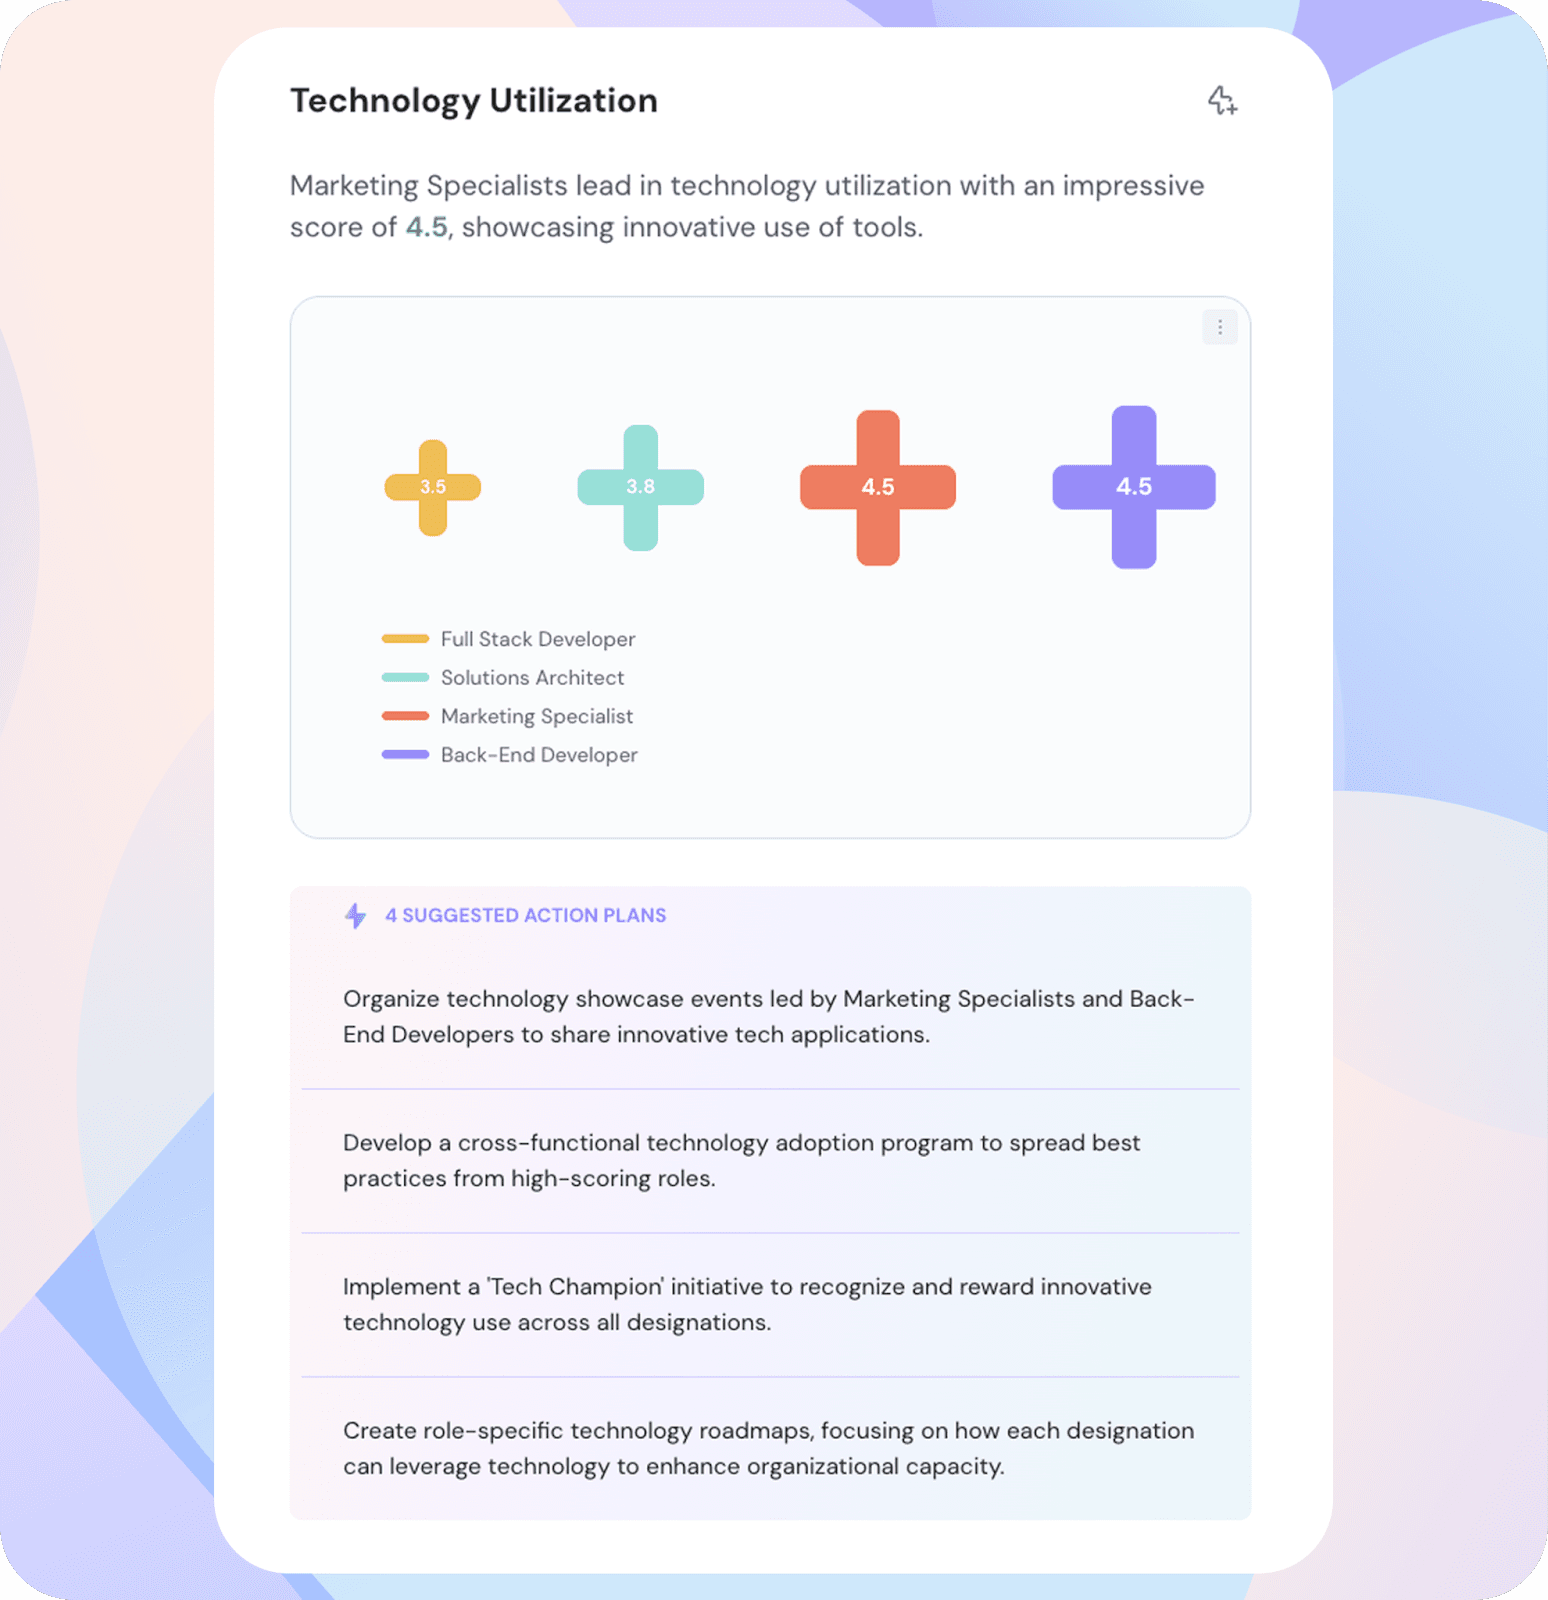
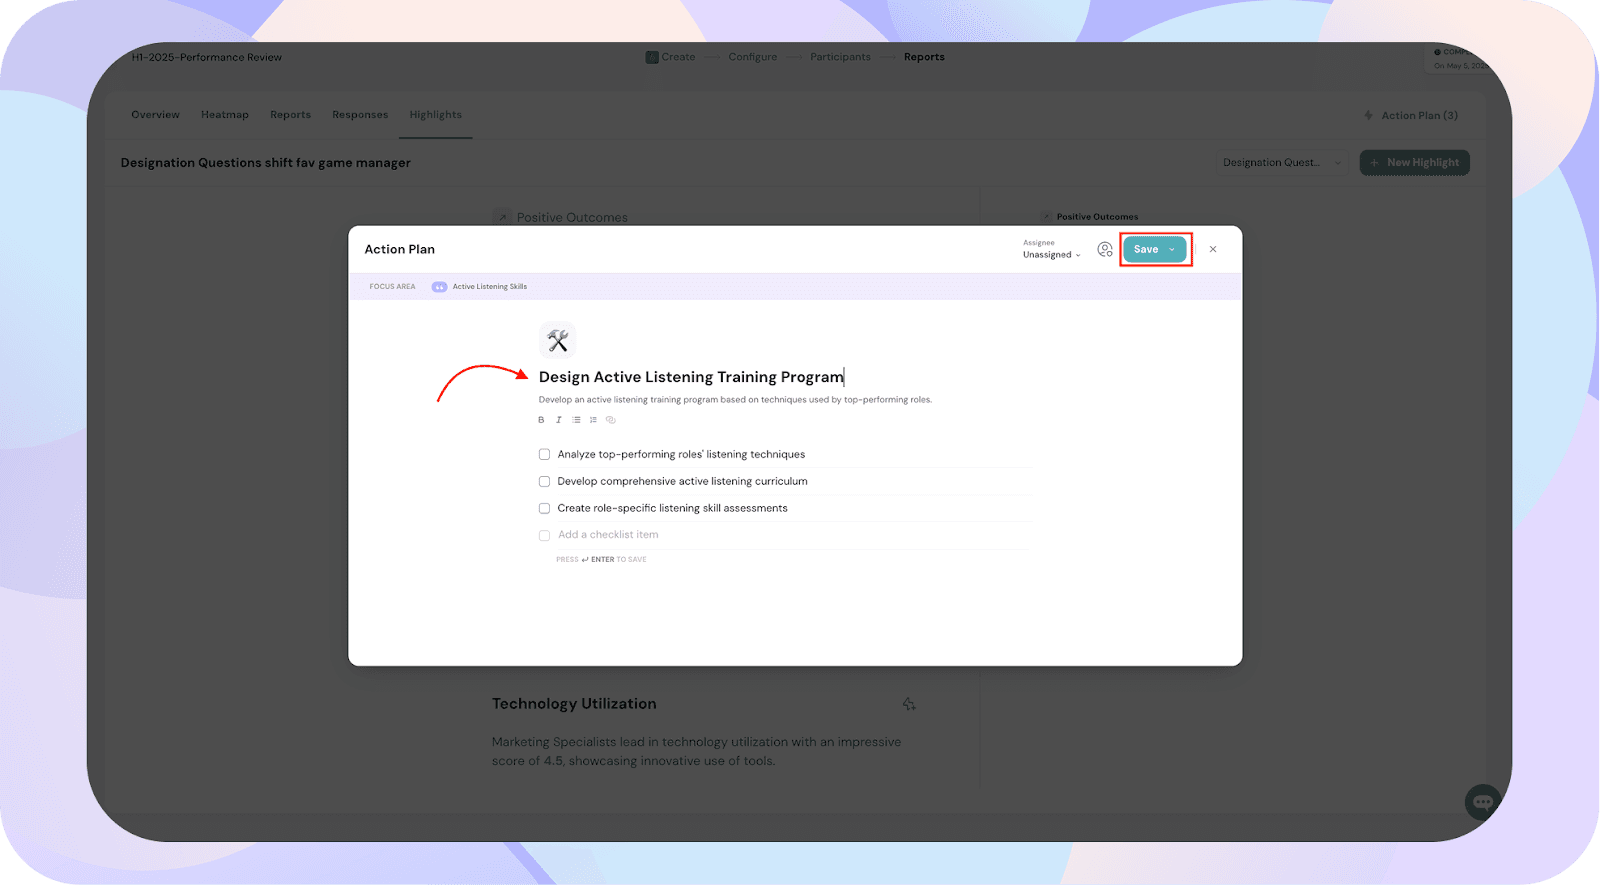
Each highlight section may contain AI-suggested action plans. Here’s how to use them:
Use the three-dot menu next to the topic to Edit, Hide, or Delete it.
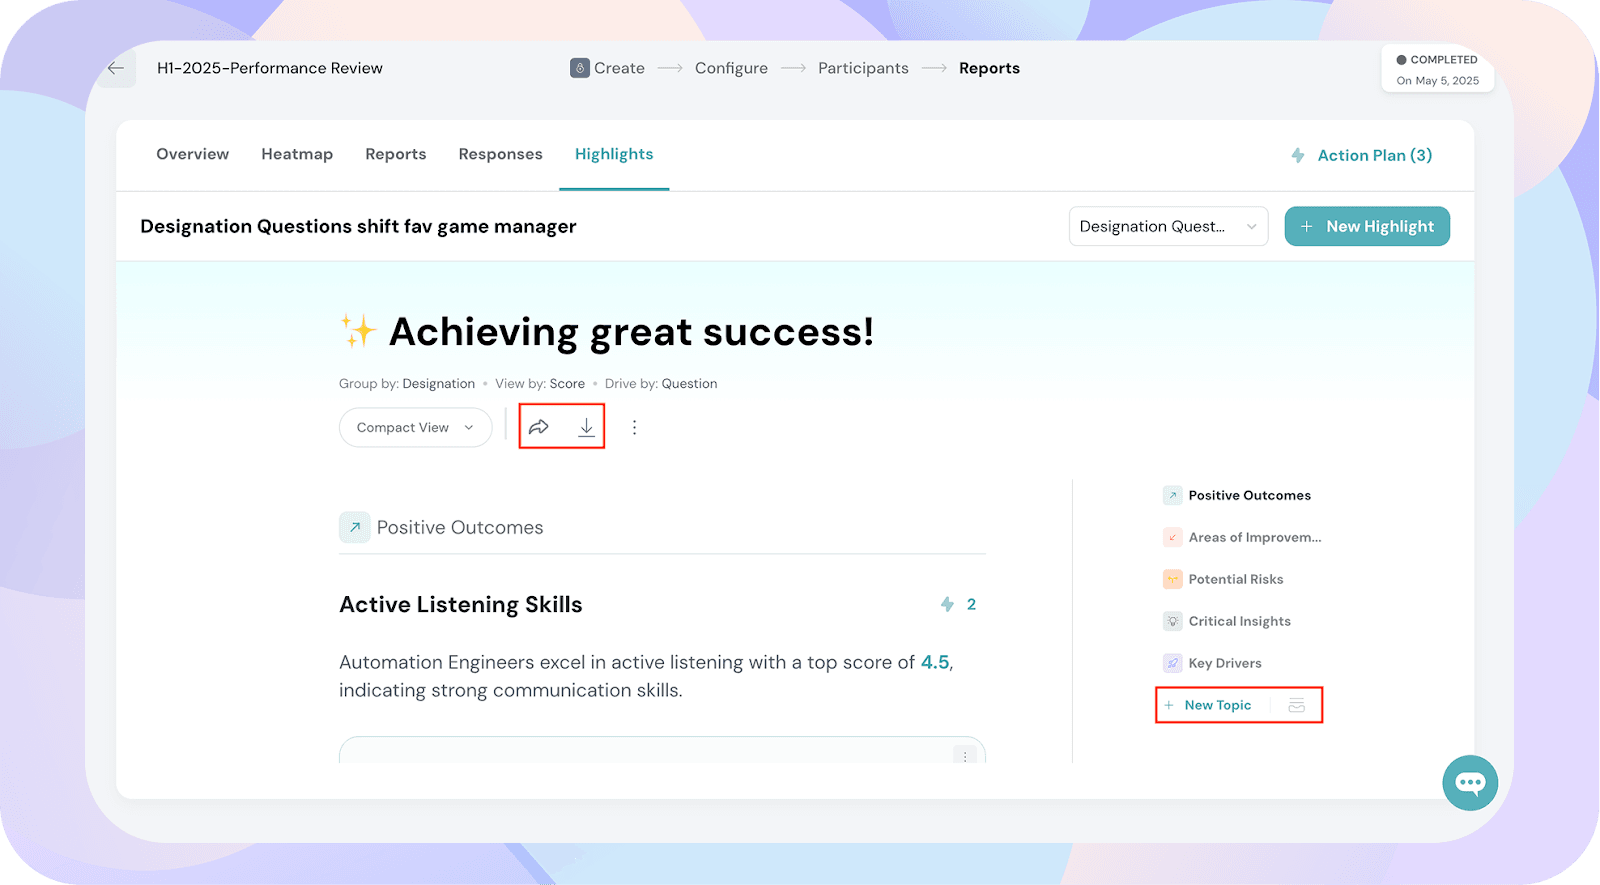
To share your Performance Highlights:
To download:
ThriveSparrow offers multiple chart types to help you visualize and interpret performance highlight data more effectively. Each chart type brings a unique lens to understand trends across roles, competencies, and performance levels. Here's a quick breakdown of each:
To change the chart type for any AI-generated insight, click the three-dot menu on the top-right corner of the chart, select your preferred visualization from the options, and click Continue to apply the change.
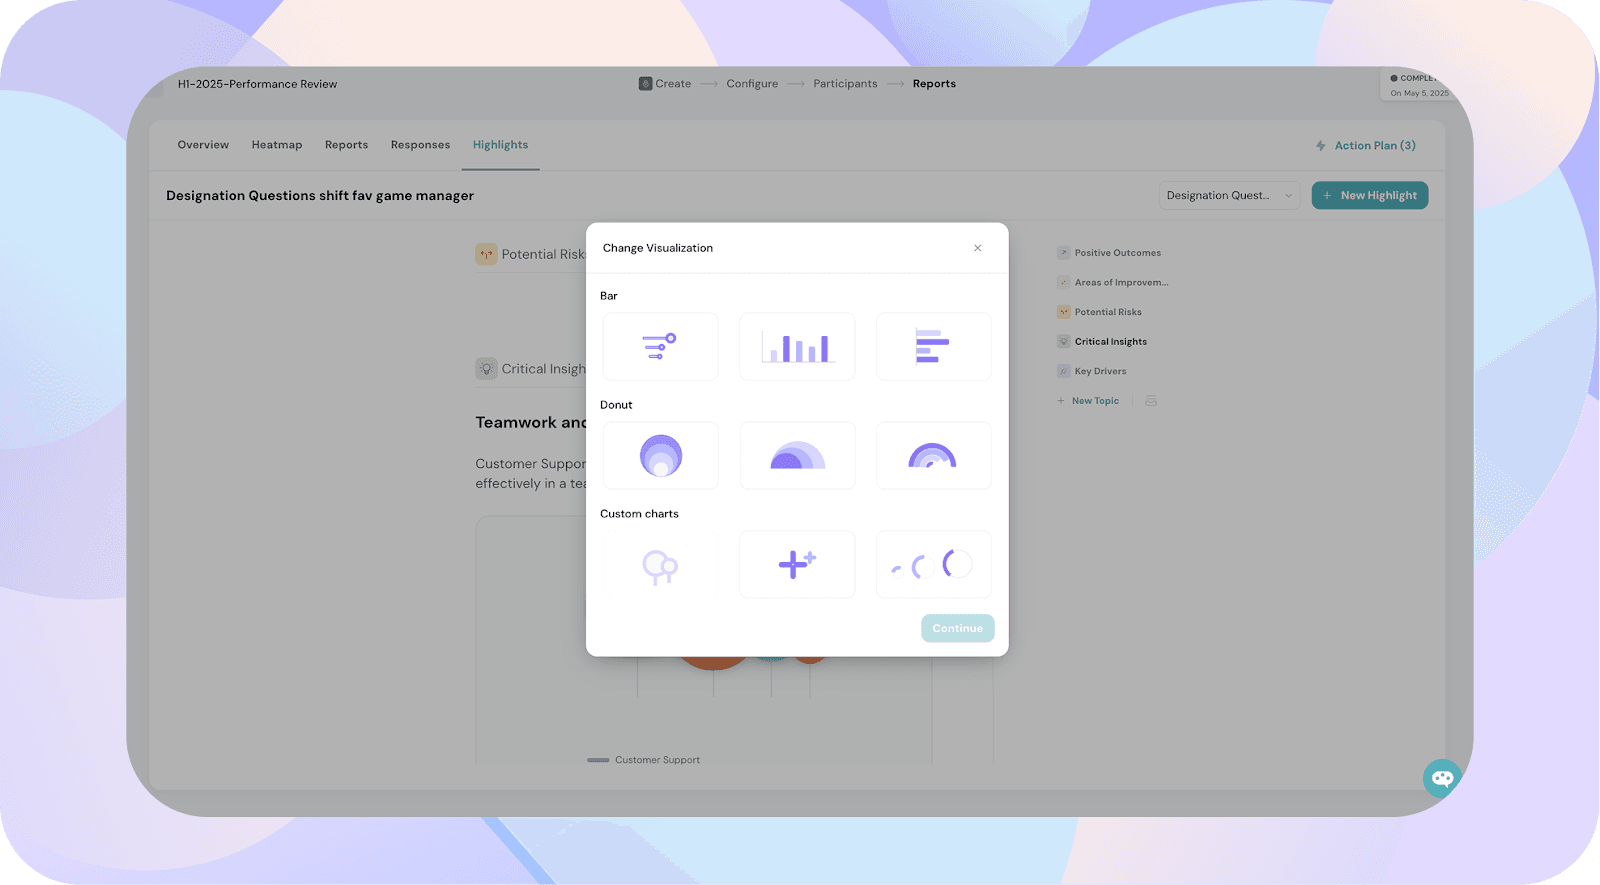
Insight Bars A simple bar chart that displays scores across roles or teams. Great for quick comparisons and identifying top and bottom performers at a glance.
Axis Insights A variation of bar charts that includes reference lines or axes to show benchmarks or thresholds. Ideal for identifying who is exceeding, meeting, or falling short of expectations.
Flow MetricsHorizontal bar layouts that visualize the flow or progression of scores across entities. Useful for showing gradual changes or role-to-role performance shifts.
Donut Charts
Nested Circular ChartDisplays score layers within each other. The innermost circle usually represents the lowest value, while the outermost shows the highest. Helps visualize performance distribution across roles.
Halo ChartHighlights performance using semi-circle arcs. Each arc reflects a different role’s score. Great for side-by-side comparisons and spotting gaps in consistency.
Spectrum LoopA rainbow-like loop that shows how scores gradually progress across designations. Helps identify smooth vs. sharp changes in team performance.
Custom Charts
Network NodesVisually maps relationships and performance connections between teams. Often used to show shared strengths or collaboration links.
Growth CompassDisplays directional strengths and performance trends. Ideal for showing which roles are trending up, stable, or need attention.
Flow CurvesCurved paths that represent performance variation in a continuous loop. Good for highlighting patterns across multiple dimensions like skill growth or response sentiment.
Powered By SparrowDesk