Search
Team Analytics is not enabled by default for 360 surveys. If you’d like to access team-level insights and comparisons, you’ll need to enable Team Analytics in the survey configuration settings. Follow these steps to enable Team Analytics and navigate through the reports effectively.
Log in to your ThriveSparrow account.
Navigate to Configure > General > Report and Portal Settings, and enable the Team Analytics options based on your requirements.
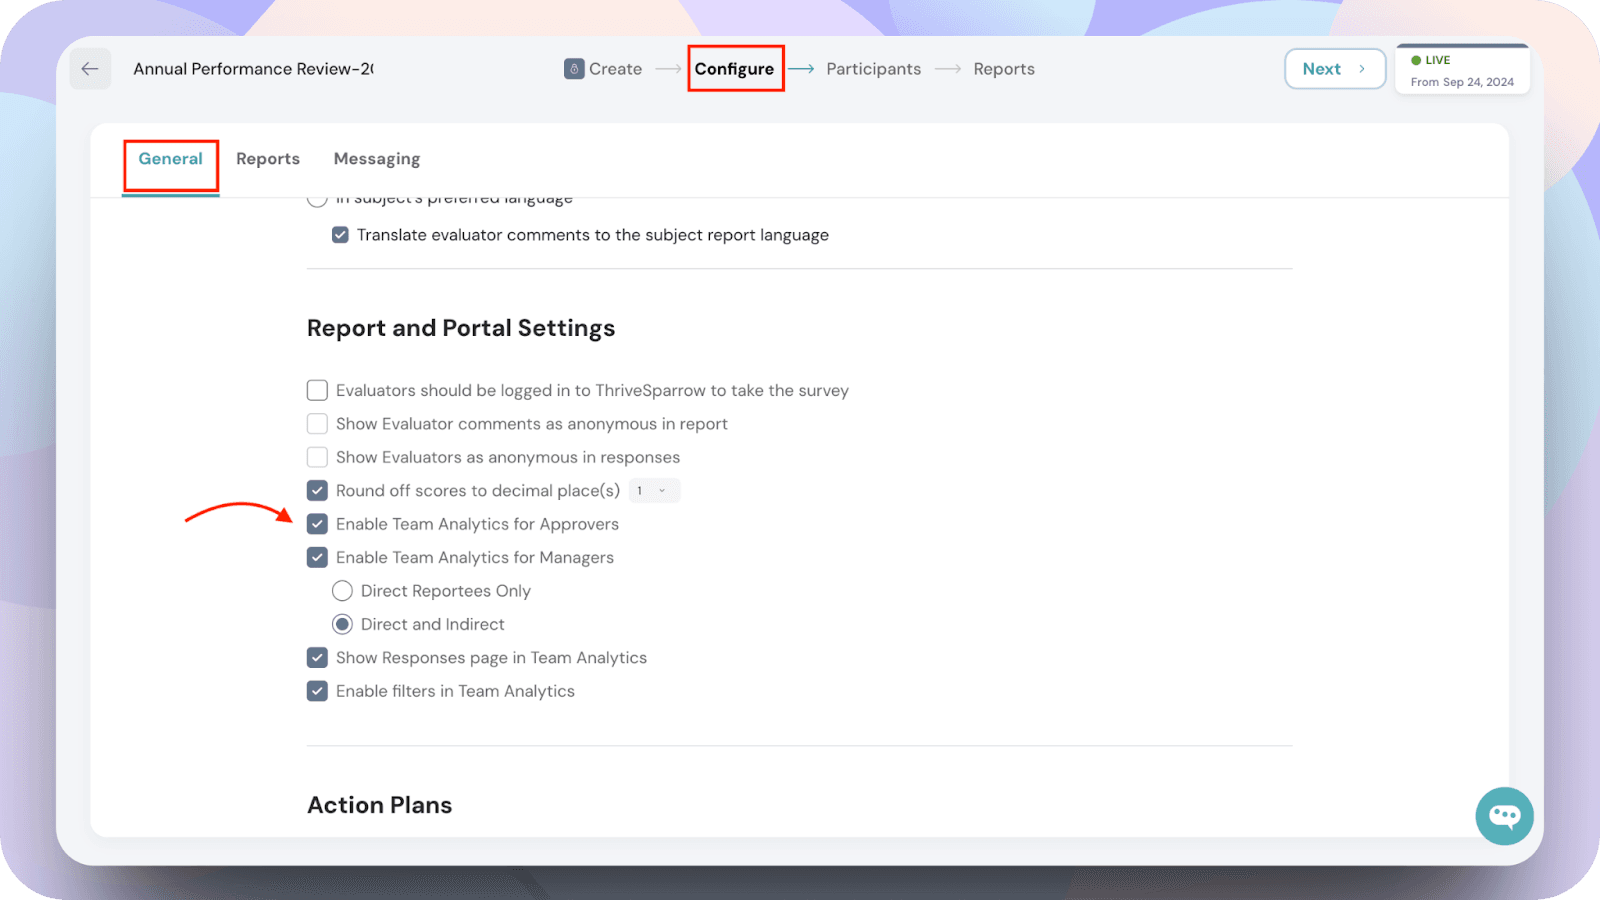
Once you have enabled the configuration,
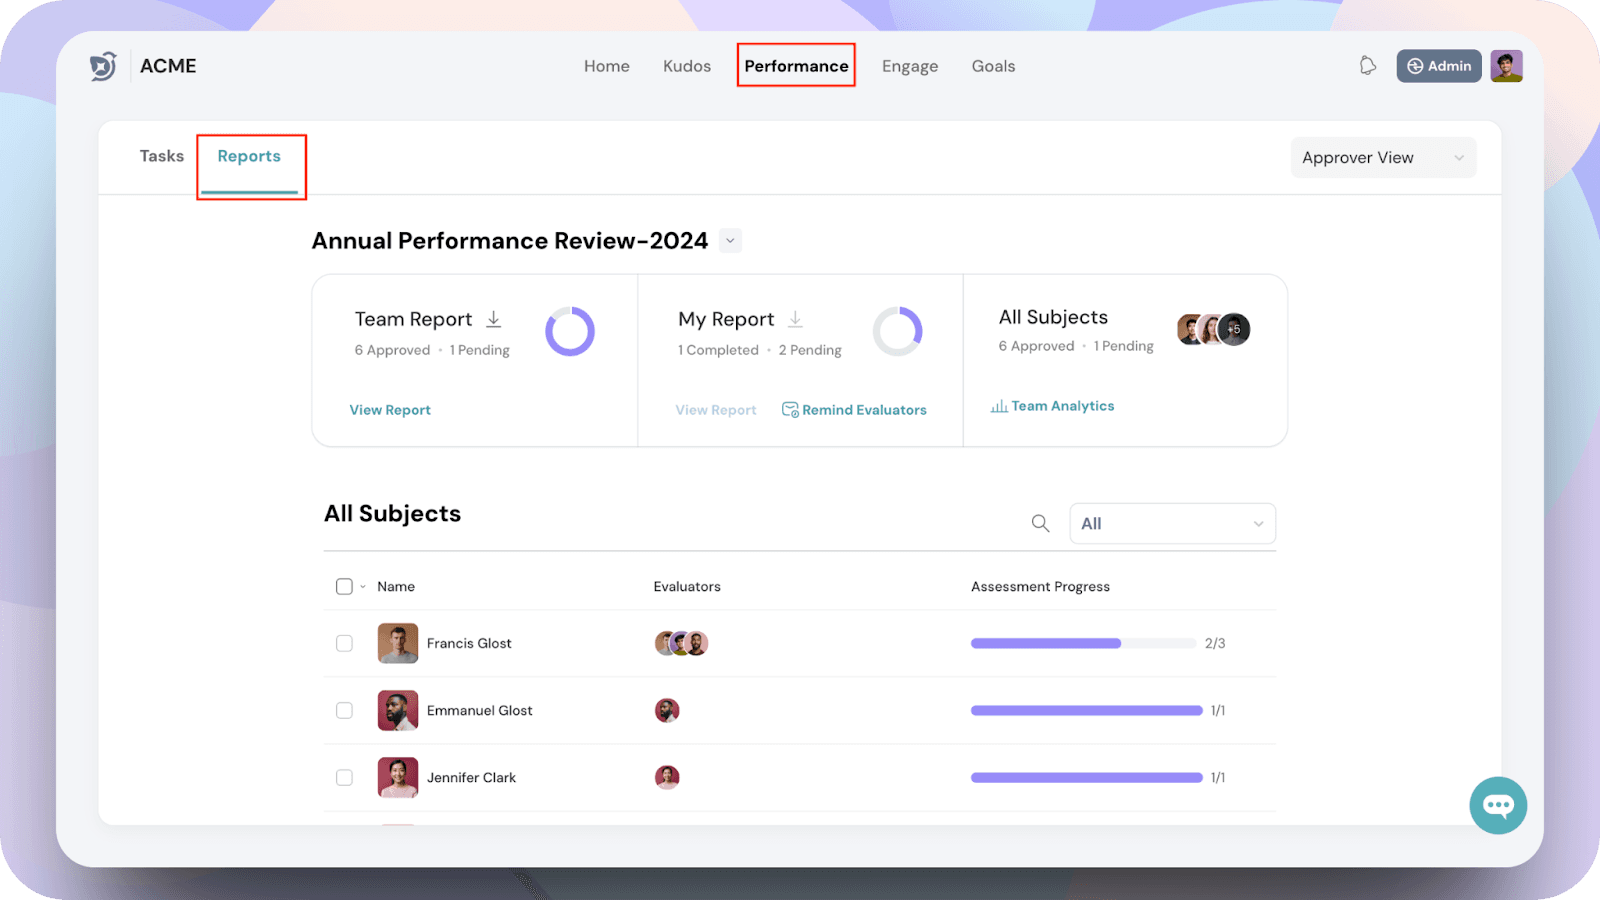
Navigate to Performance and select Reports.
You will now see the report for the survey you are currently viewing.
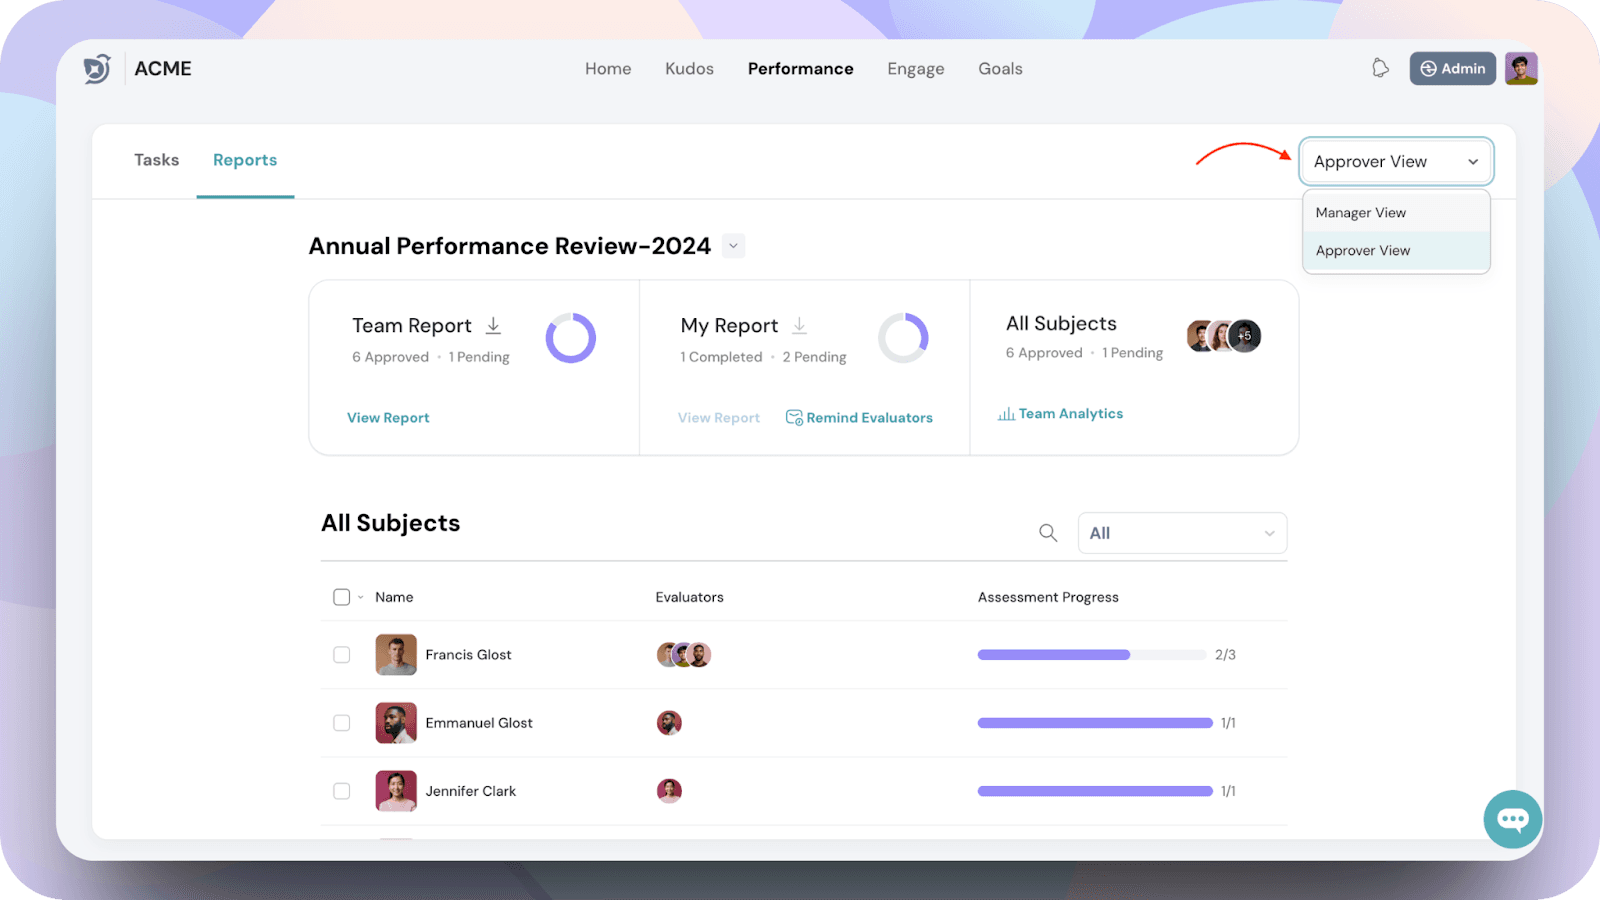
You have two views you can switch between: the Manager's View and the Approver's View.
Note: This view switcher is only visible to users who are both a Manager and an Approver. If you're assigned only one of these roles, you will not see the option to switch views.
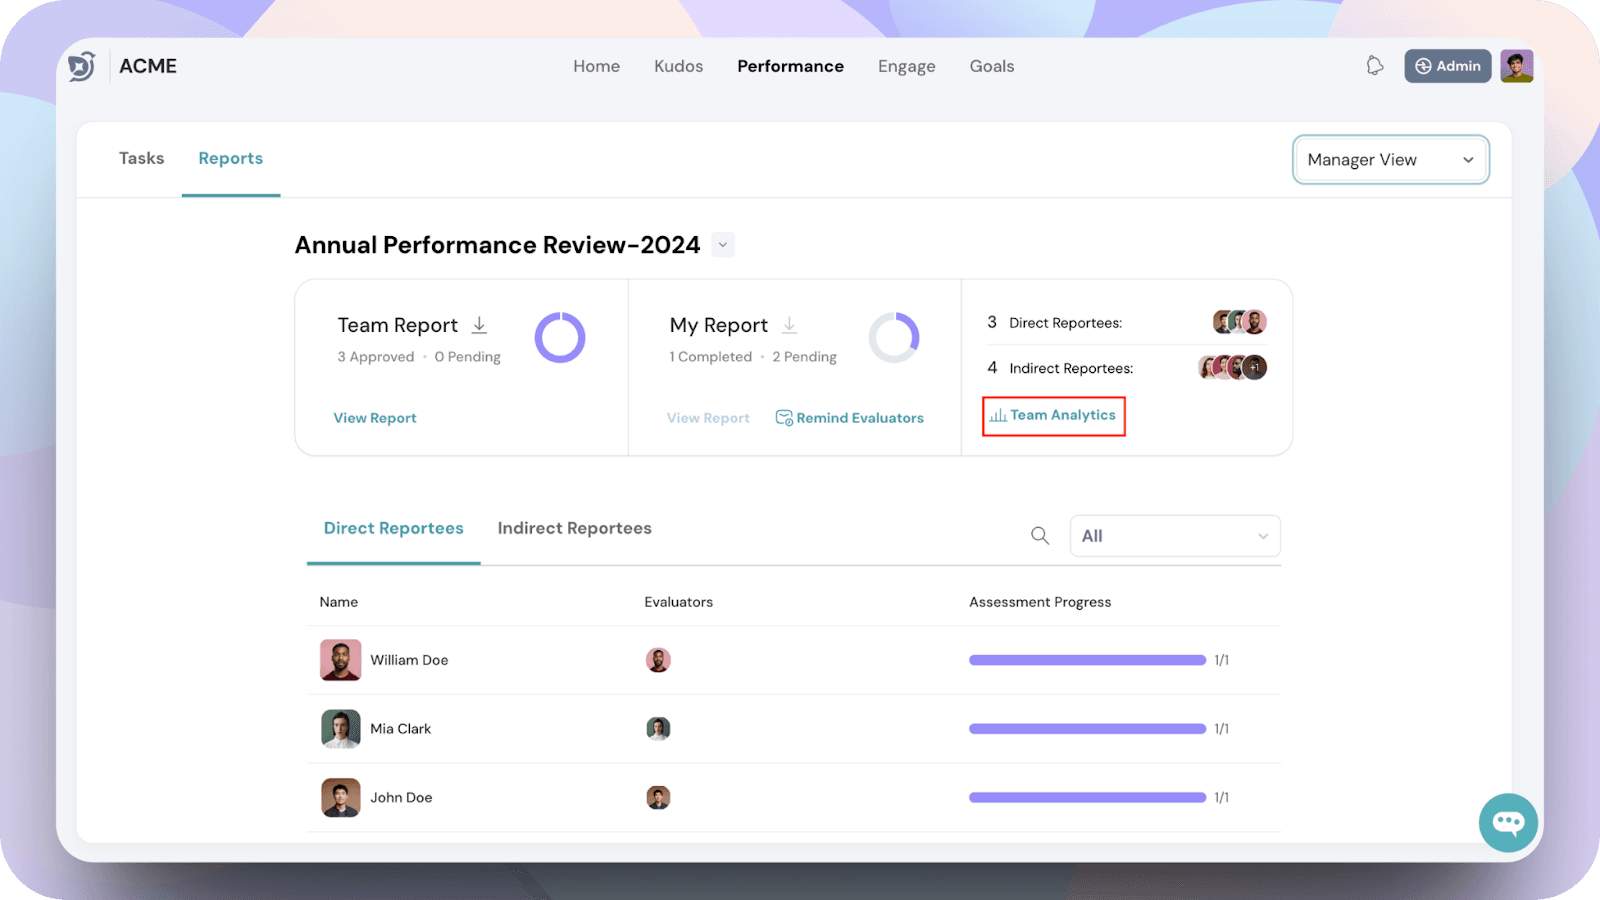
Now, you can click on Team Analytics to explore detailed insights about your team's performance.
Note: Team Analytics must be enabled in the survey configuration to access this section.
Within Team Analytics, the first thing you will find is an Overview of the report.Note: This article walks you through the Manager’s View. If you're a manager, if the settings are enabled by the admin, you'll be able to filter the data by:
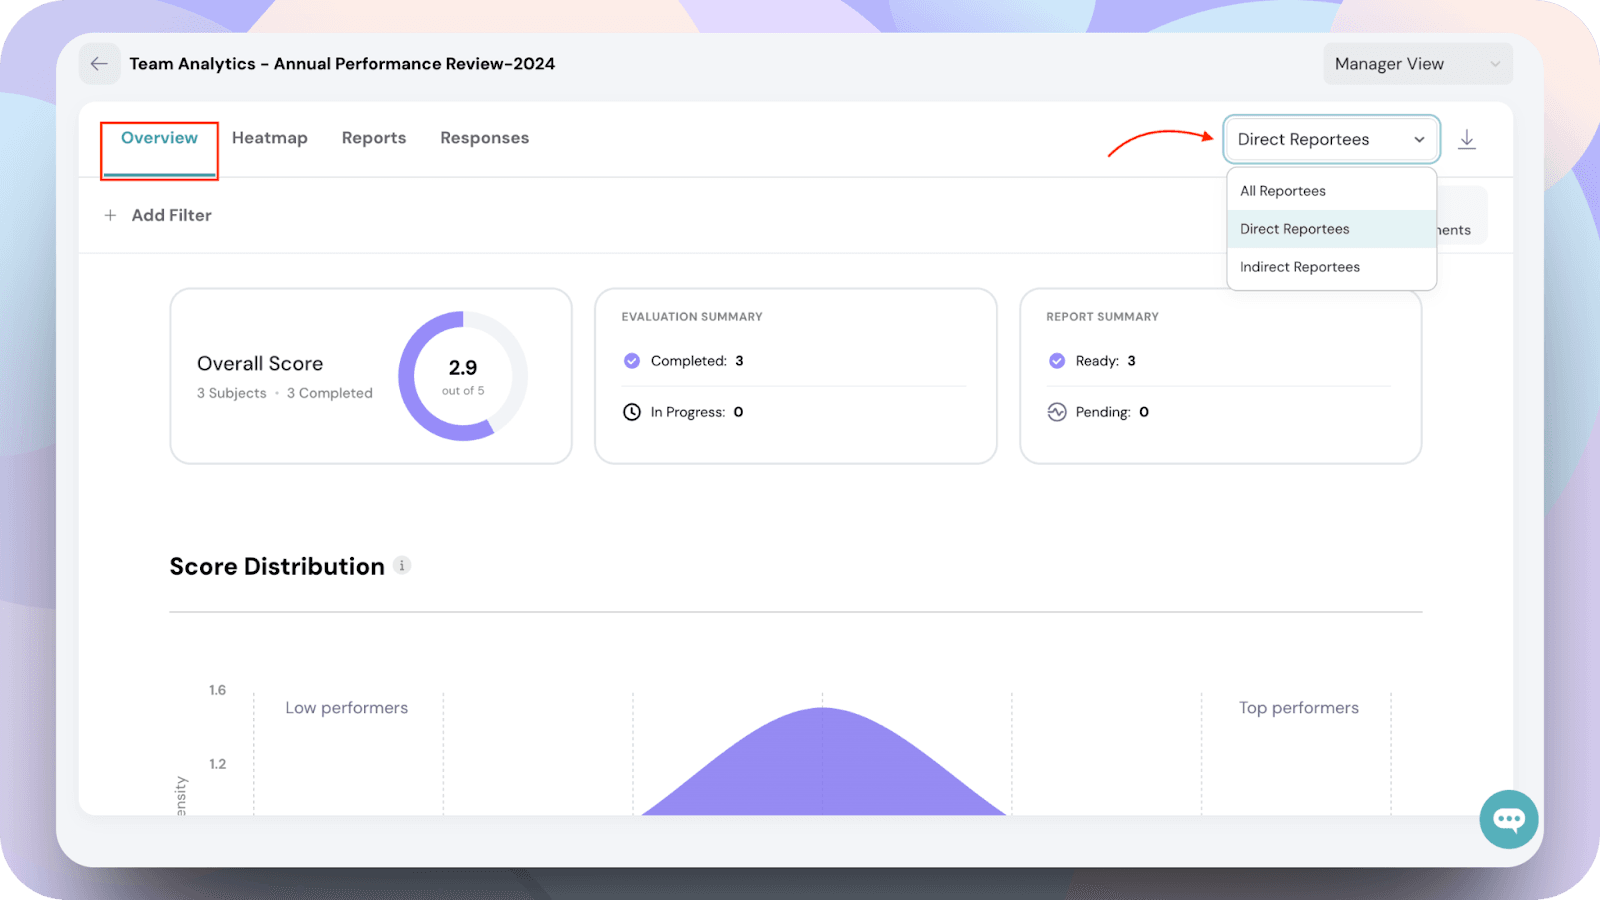
Also in the Overview section, you will be able to find the Overall Score, Evaluation Summary, and Report Summary.
You can filter the data if the admin has enabled filtering in Team Analytics for your organization.
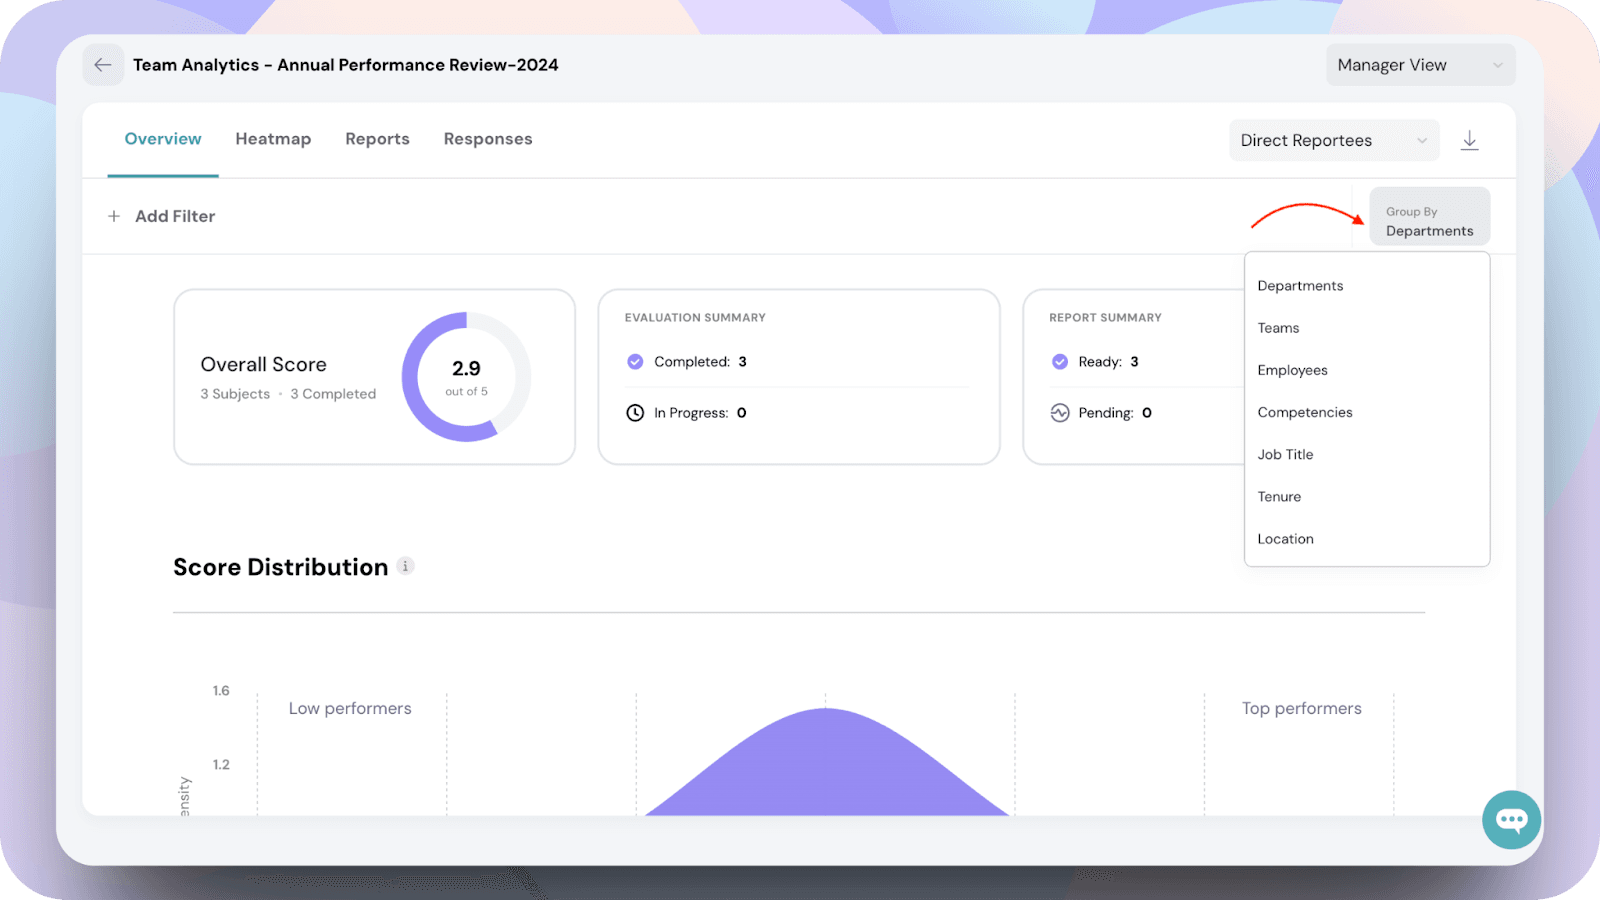
You can also group the data using the dropdown to view insights by:
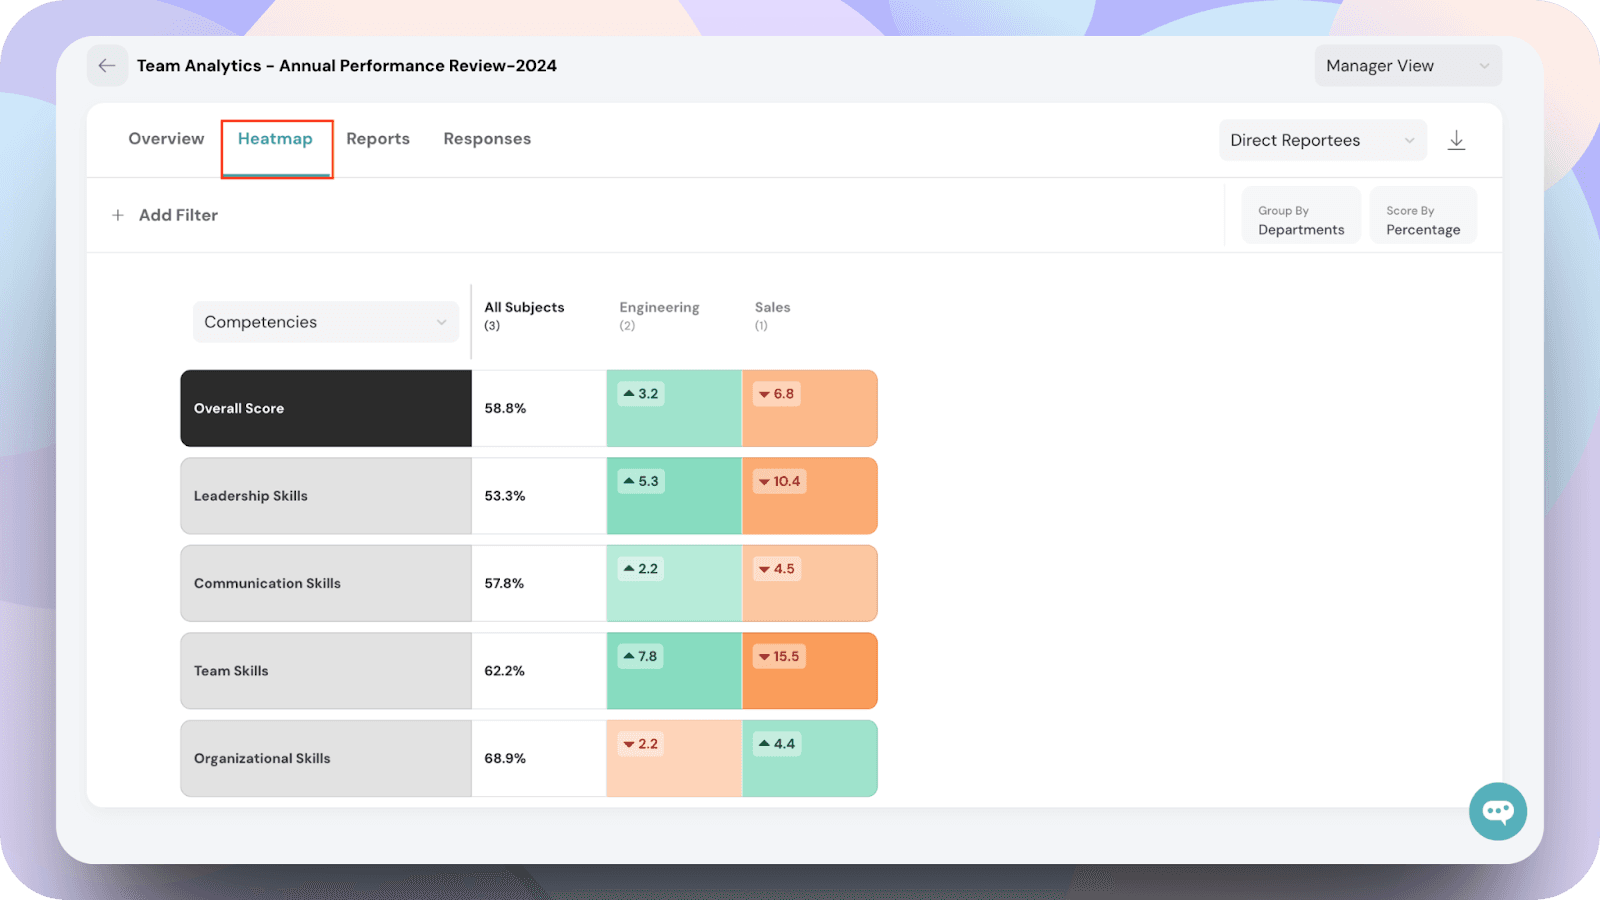
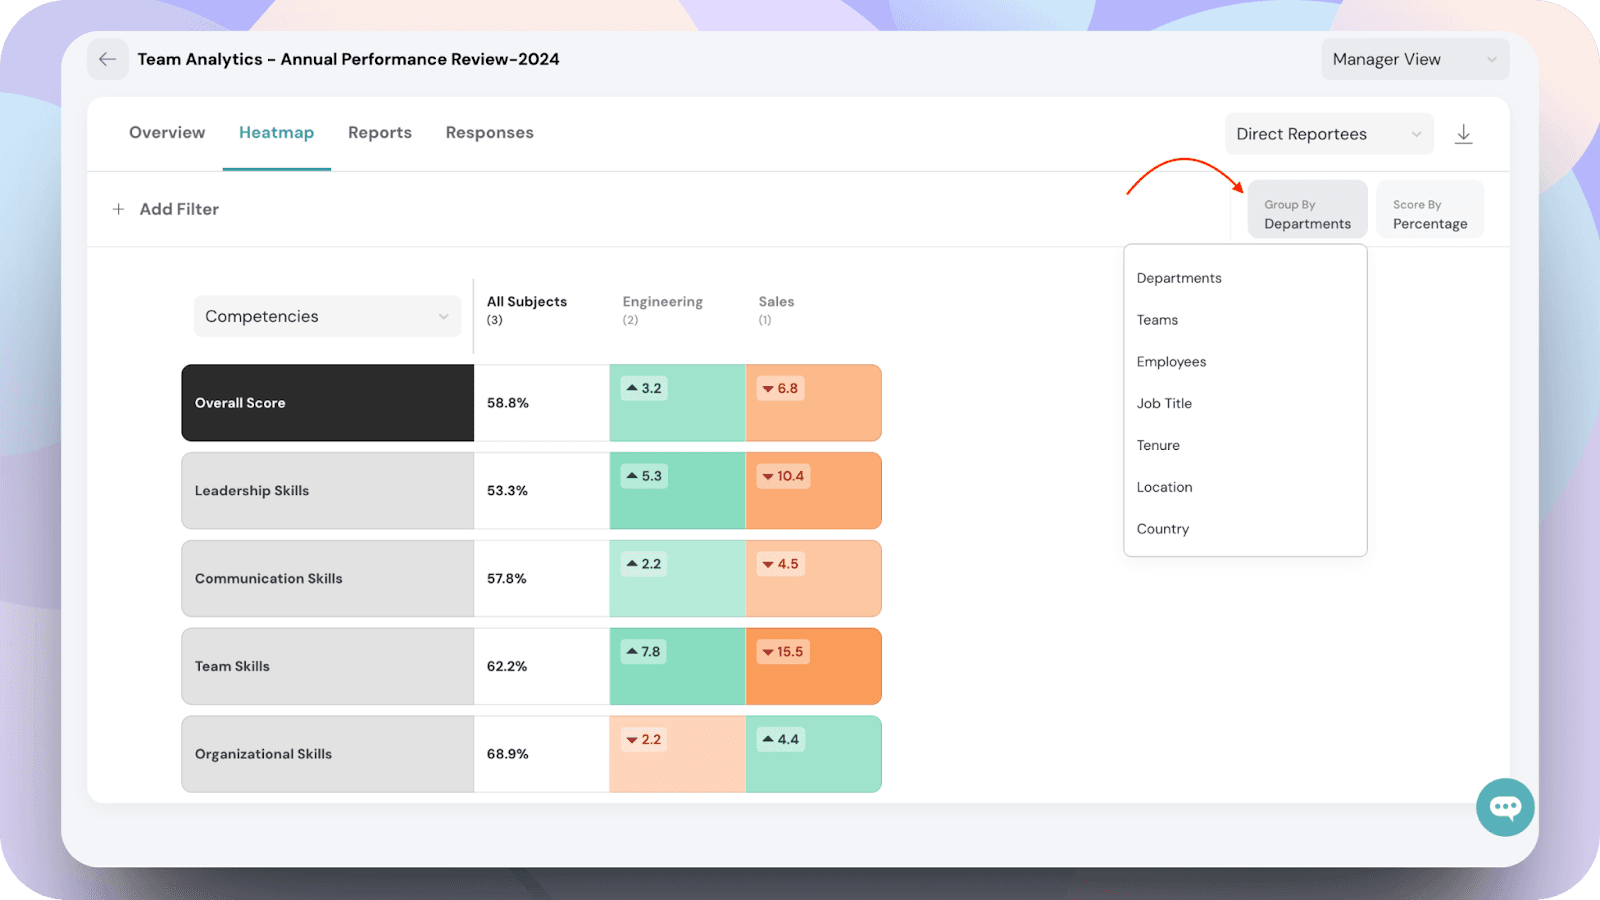
The next section is the Heatmap. Here, you will be able to see how your department’s score compares with other departments.
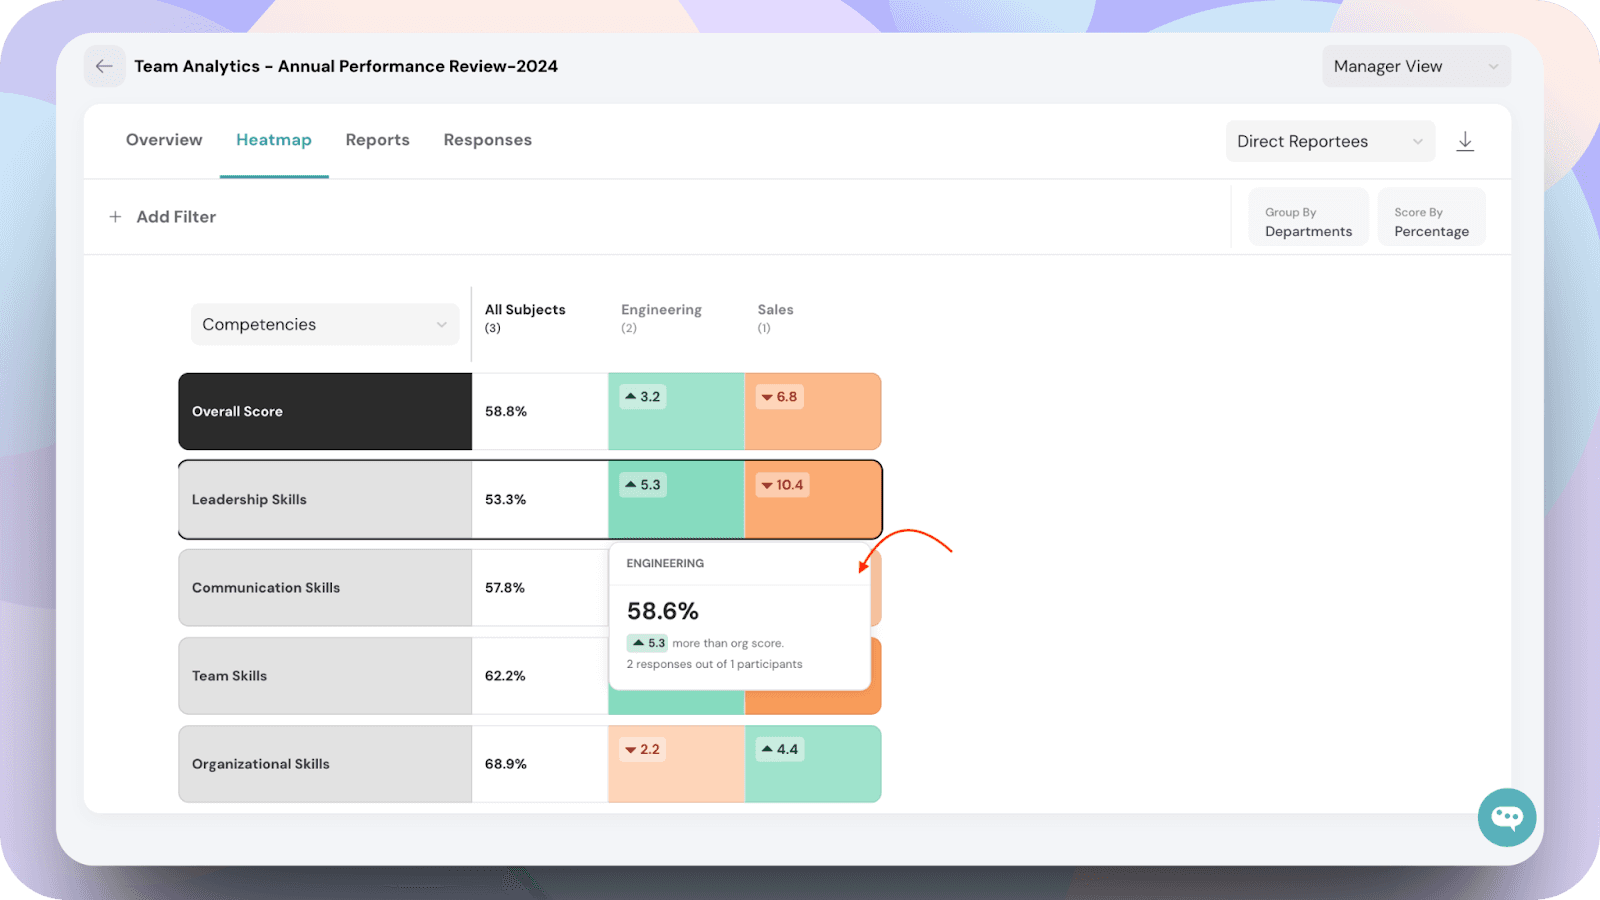
You can hover over each tile in the heatmap to get detailed insights into how your team has performed on specific competencies or questions.
You can group data in the Heatmap section as well by departments, teams, employees, job title, tenure, location or country to compare performance across different segments more effectively.
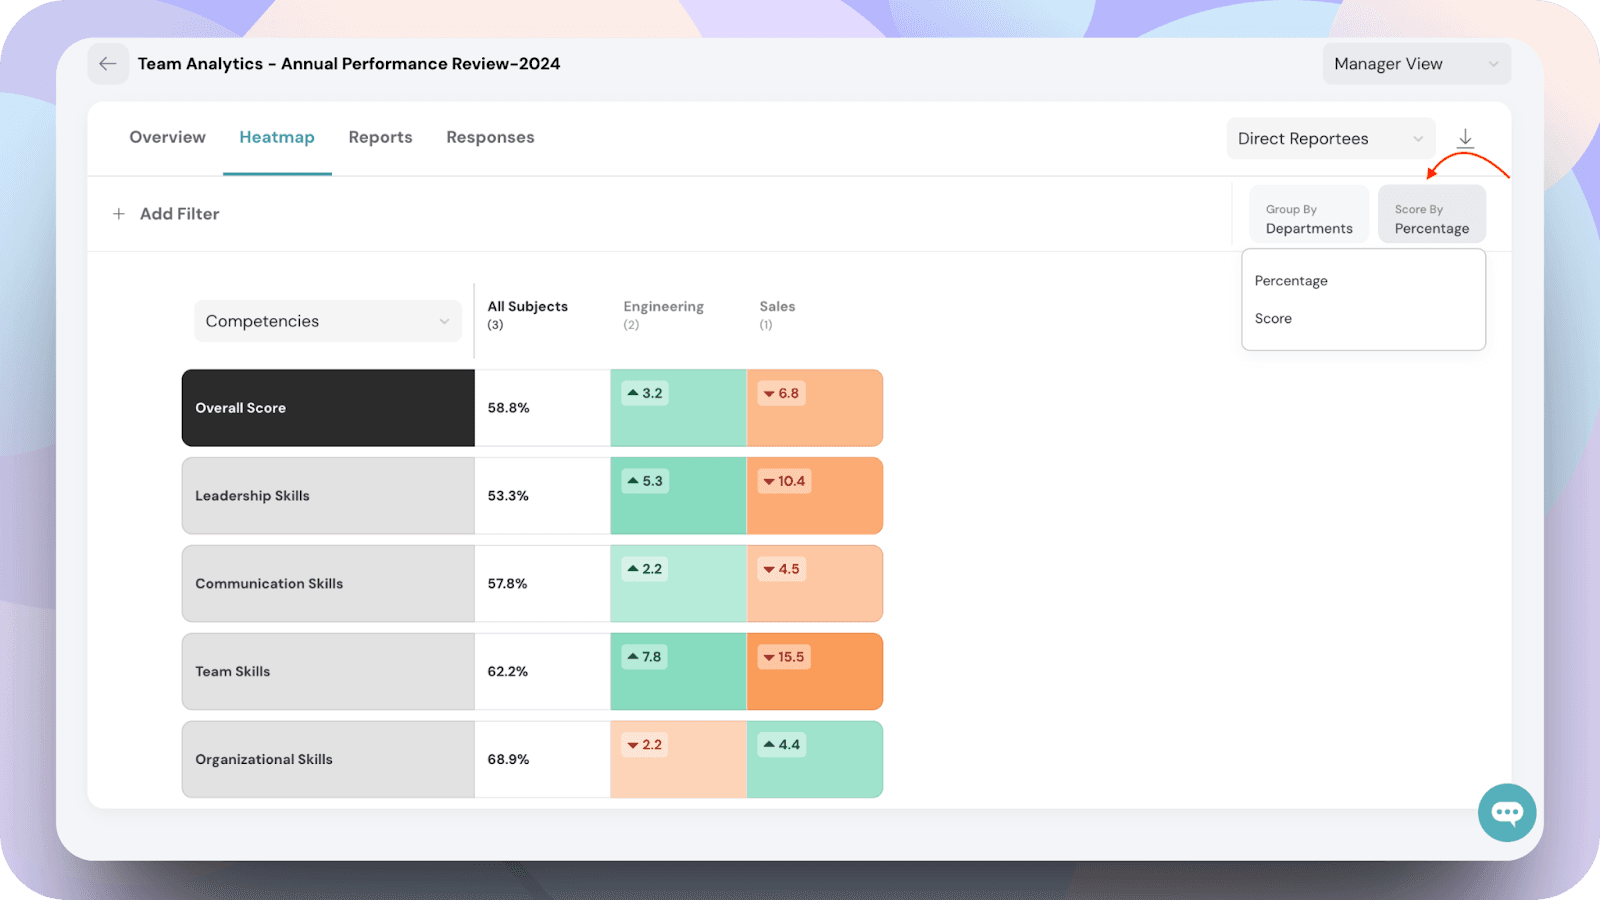
You can filter the scores in the Heatmap section either by percentage or by score.
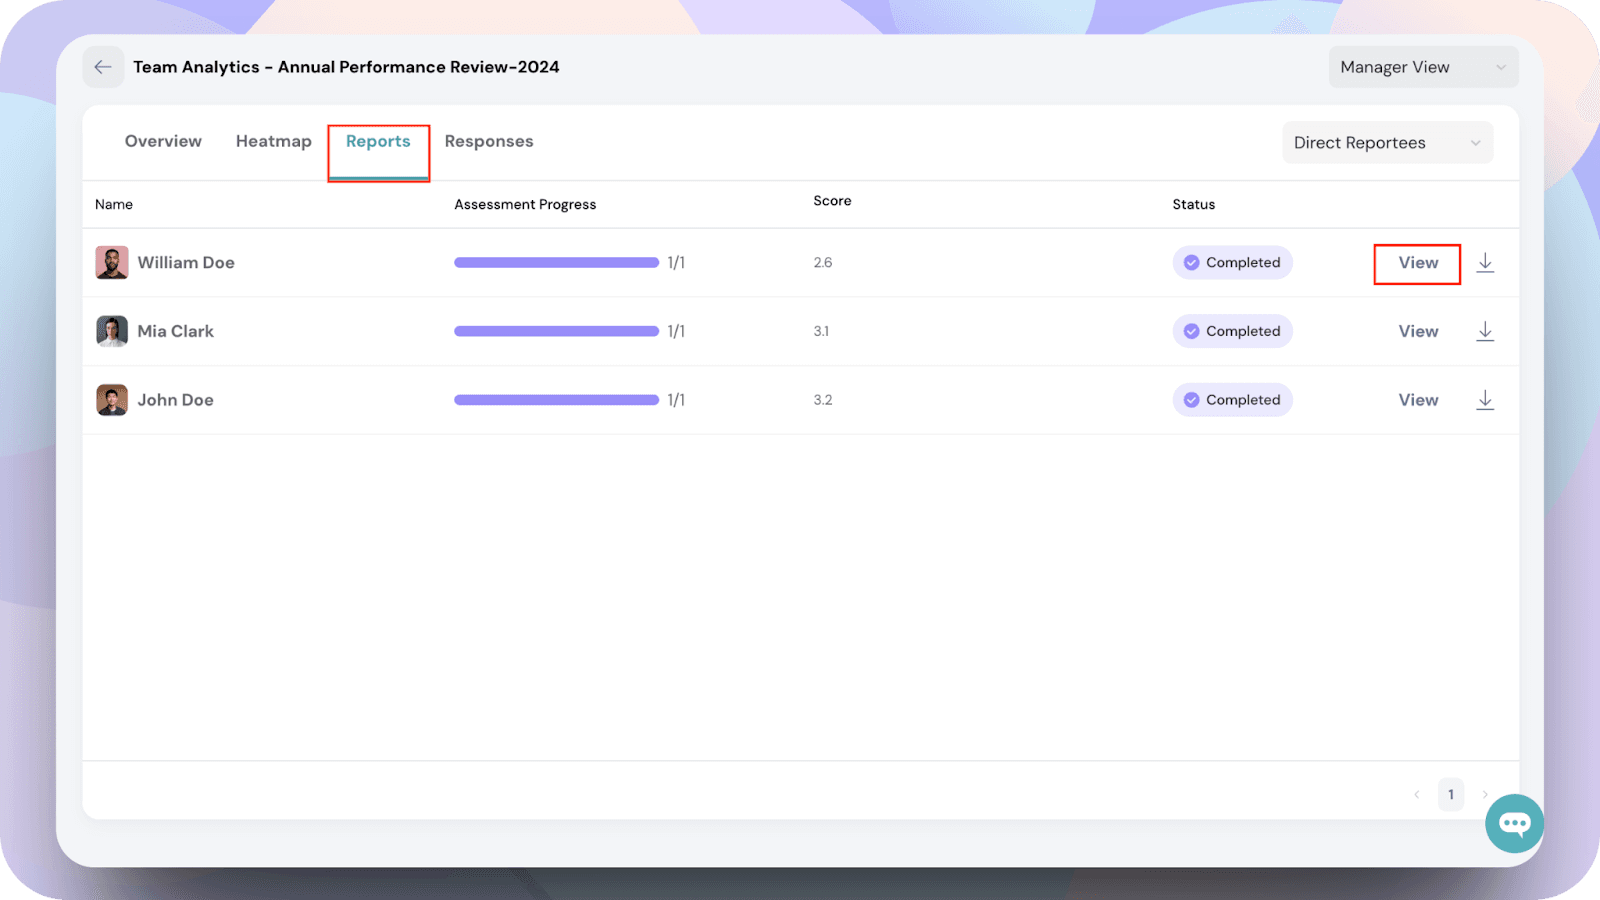
The Reports section displays the individual reports of all your approved reportees.
Click on View next to a reportee’s name to access and explore their detailed performance report.
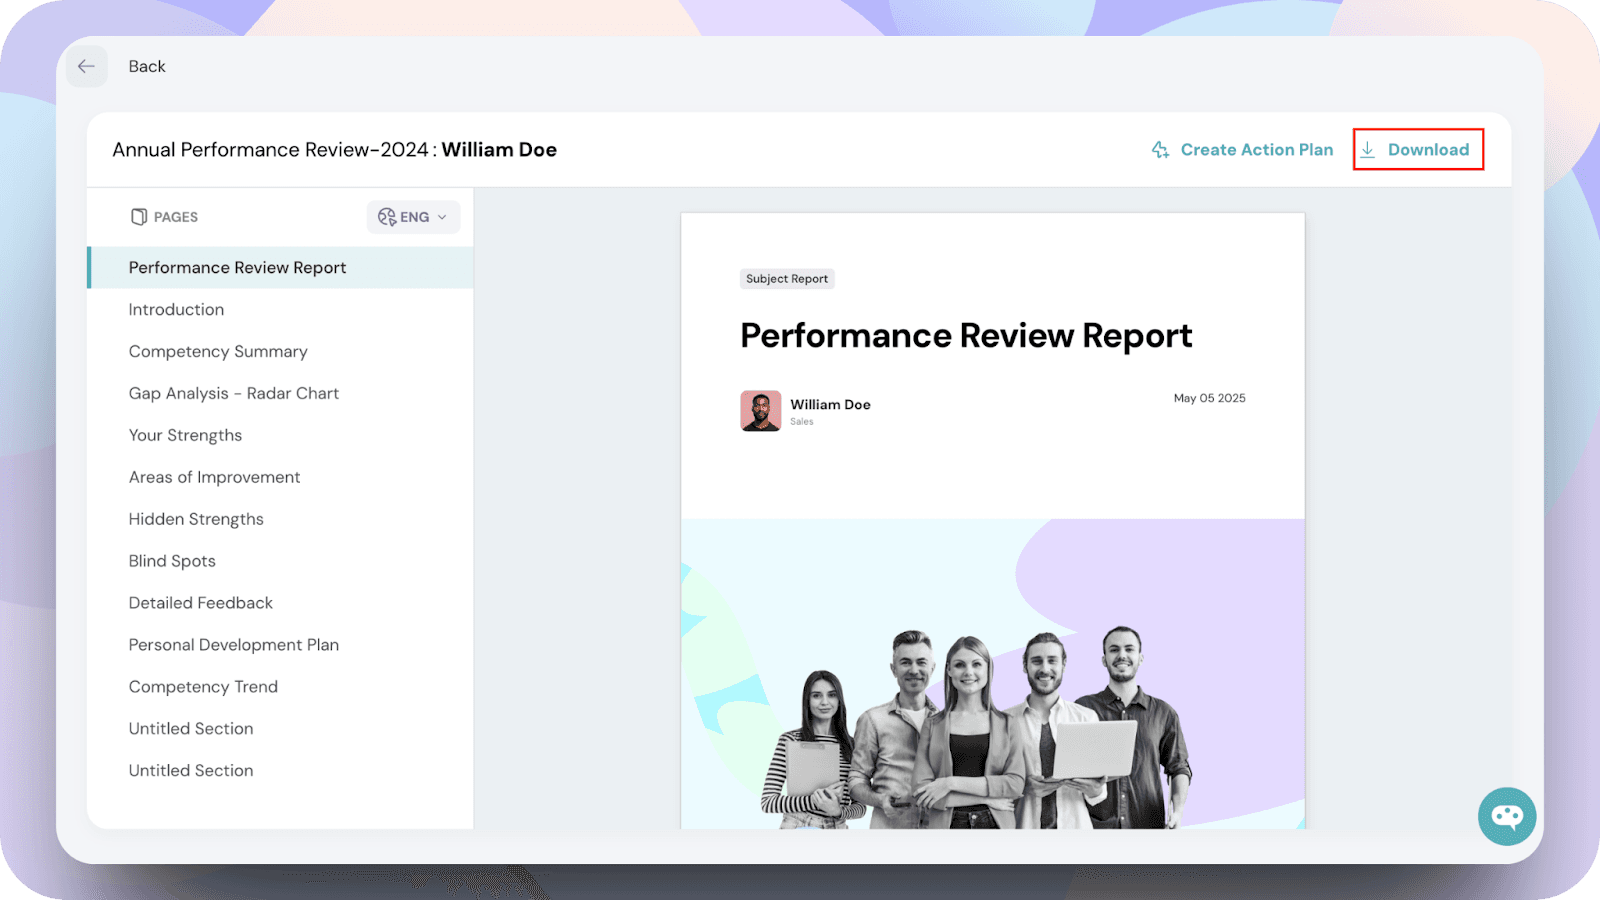
You will be able to view the detailed report and also download it as a PDF for easy sharing or record-keeping.
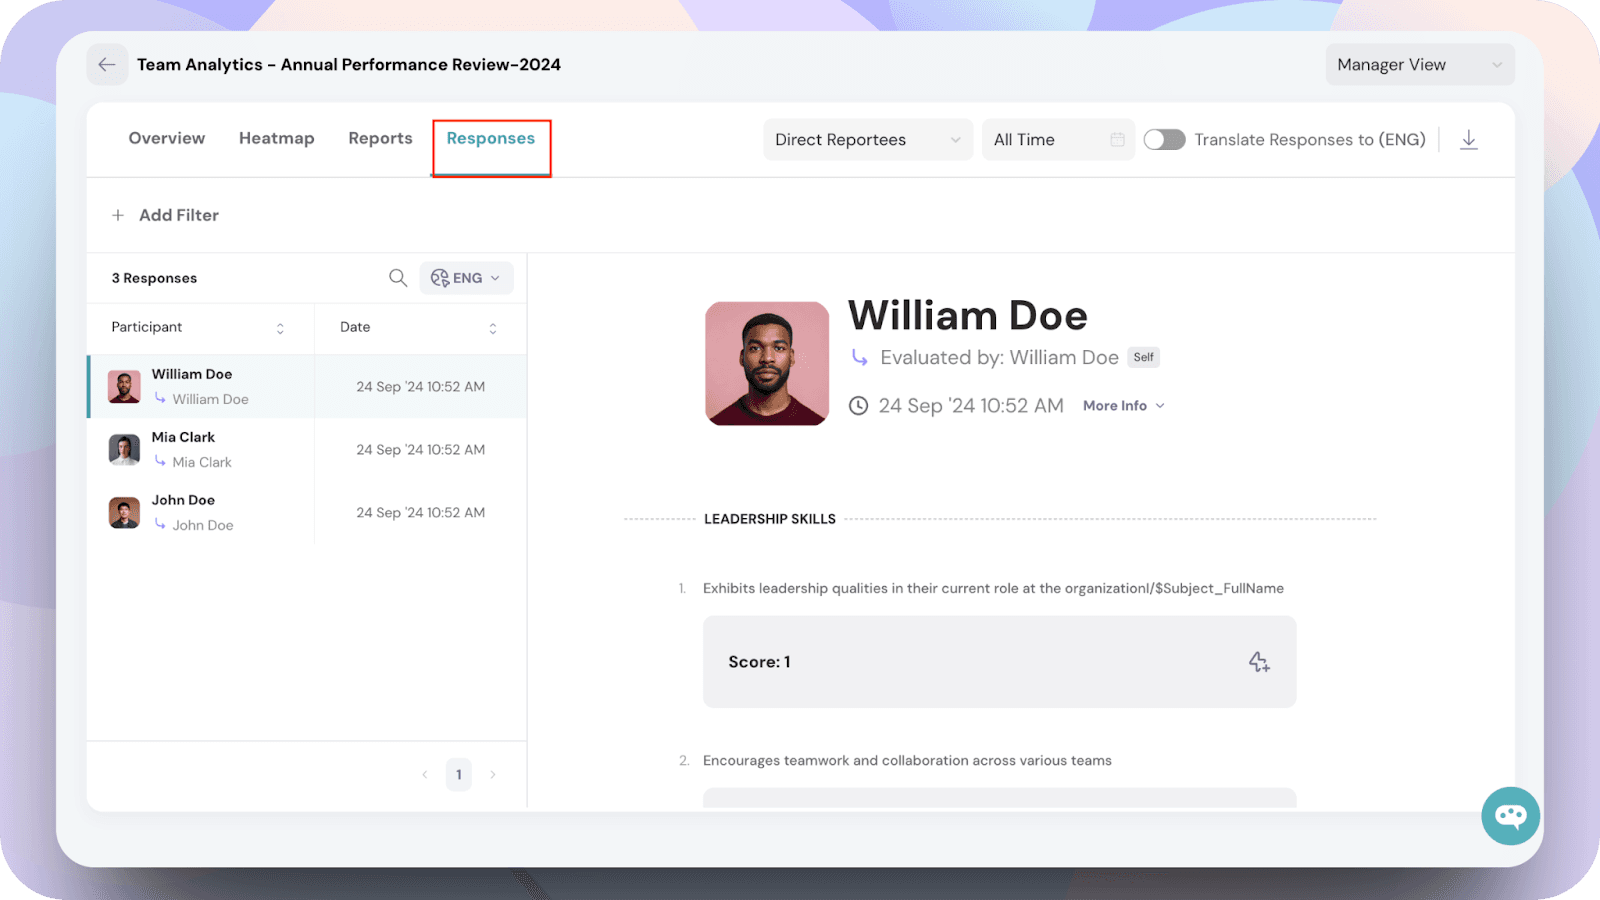
The Responses section displays the individual responses submitted by employees for each question in the survey.
Note: This section is not enabled by default for managers. Admins have control over the visibility of this page and can choose to enable or restrict access based on their preferences.
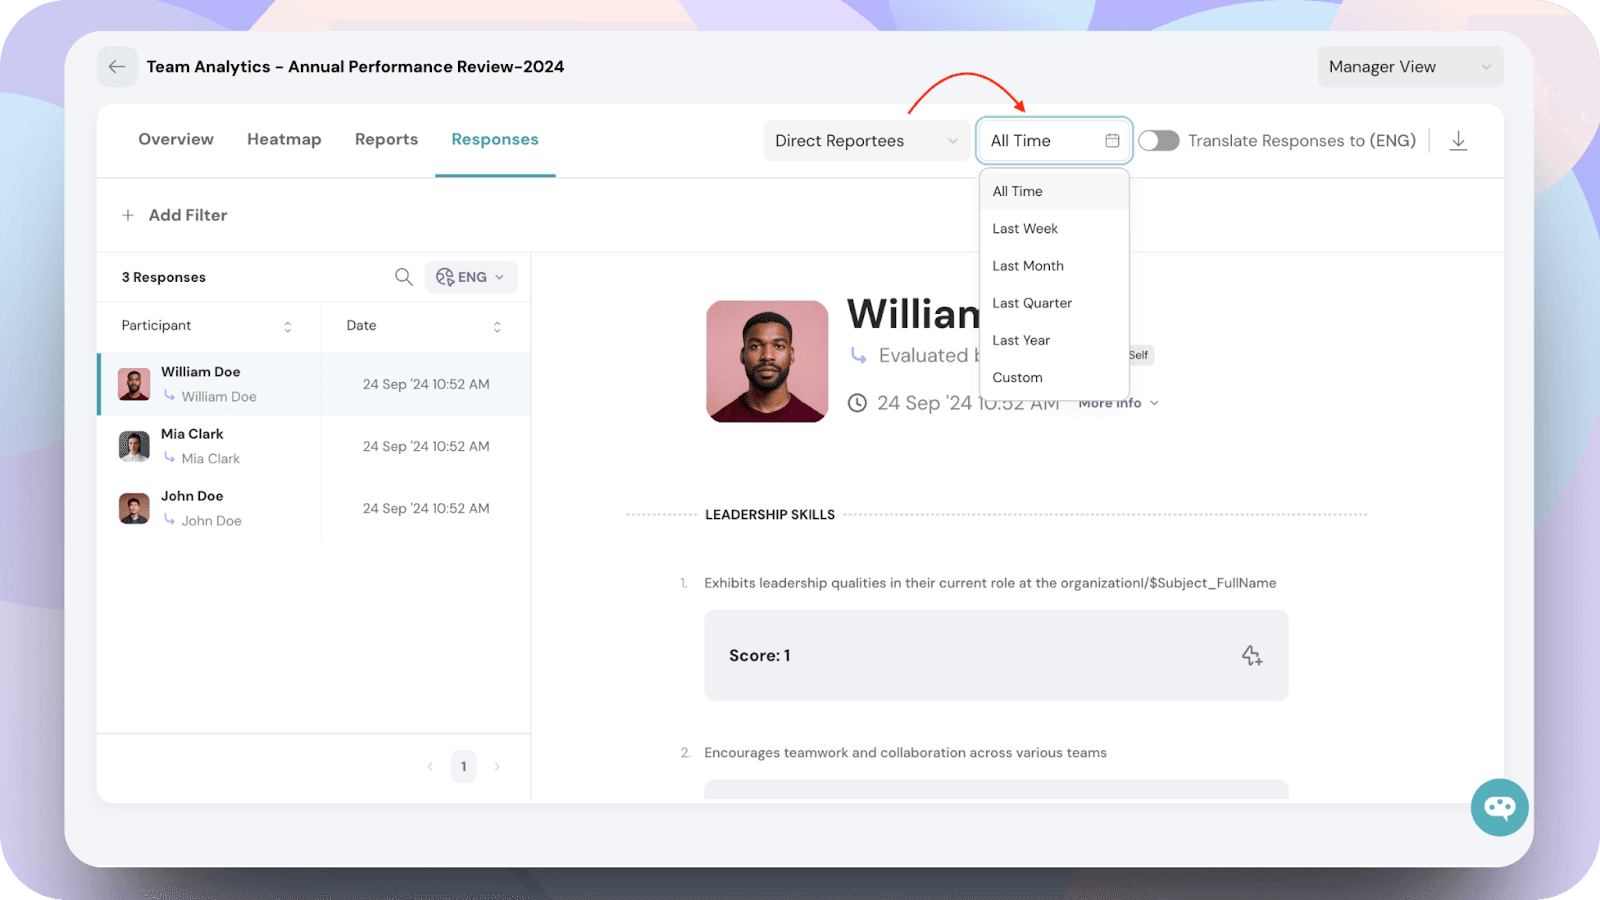
You can filter the Responses section by yearly, monthly, quarterly, weekly, or even set a custom date range to view specific periods.
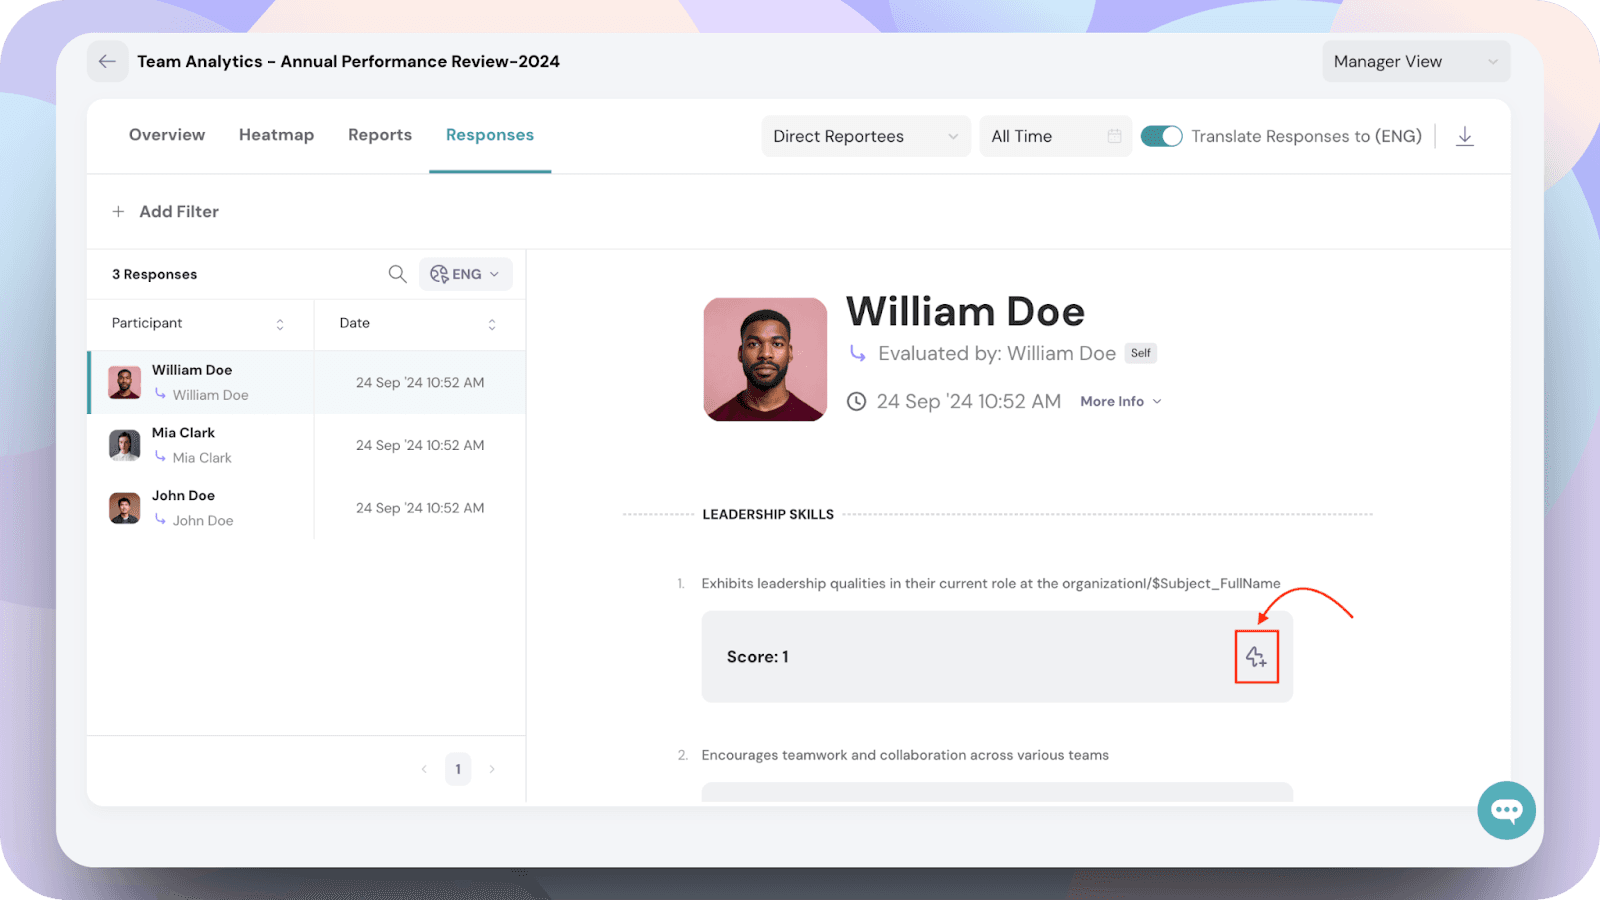
You can directly create personalized action plans based on the survey responses by clicking on the action plan icon.
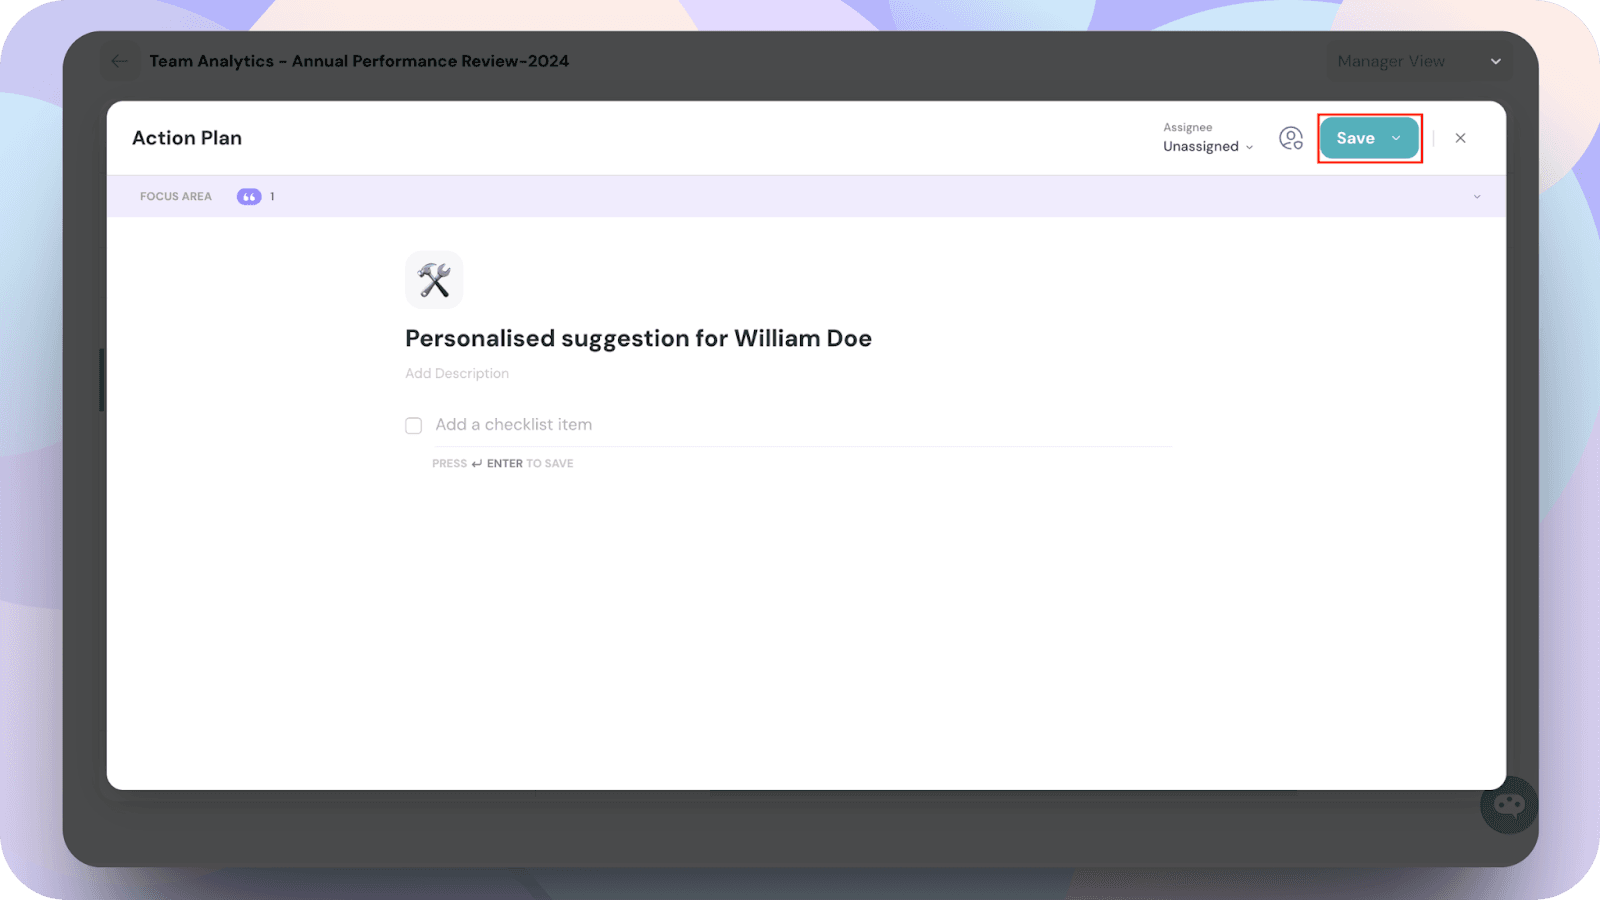
In the action plan template, fill in the necessary details, and then click Save to create the action plan.
Powered By SparrowDesk