eNPS report guide
ThriveSparrow's eNPS report sheds light on your employees' satisfaction and willingness to be your company's biggest cheerleader. This guide will decipher each section of the report, helping you unlock valuable insights to cultivate a workplace that fosters advocacy.
Accessing Your Report:
- Navigate to the Engage module or the Surveys tile on the Overview page.
- Select the completed pulse survey you want to analyze and click the Reports tab -> eNPS.
Overview:
- Overall eNPS Score: This number reflects your company's general employee sentiment. A higher score indicates a more satisfied and enthusiastic workforce.
- Distribution: This section dives deeper, revealing the percentage breakdown of promoters, passives, and detractors.
- Promoters (blue): These are your employee champions, likely to sing your praises and recommend your company to others.
- Passives (yellow): These employees are somewhat satisfied but might not actively advocate for your company.
- Detractors (red): These unhappy employees could potentially damage your company's reputation through word-of-mouth.
- Top Promoter & Detractor Groups: This section highlights the group with the highest percentages of promoters and detractors compared to the overall score. This helps you identify pockets of strong advocacy or areas needing immediate attention.

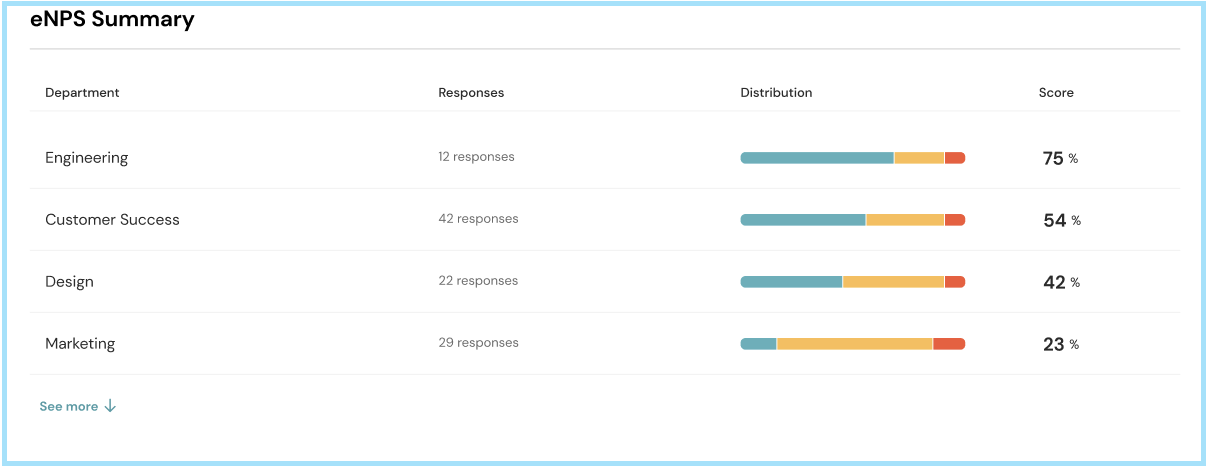
eNPS Summary:
Similar to the pulse survey report, the eNPS summary provides a more granular view based on your chosen group (department, manager, etc.):
This section breaks down the following for your chosen group:
- eNPS Score: See how the eNPS score for this specific group compares to the overall company score.
- Distribution (Promoters, Passives, Detractors): Understand the sentiment breakdown within this group.
By analyzing the eNPS summary for different groups, you can identify areas excelling in advocacy or needing improvement efforts.

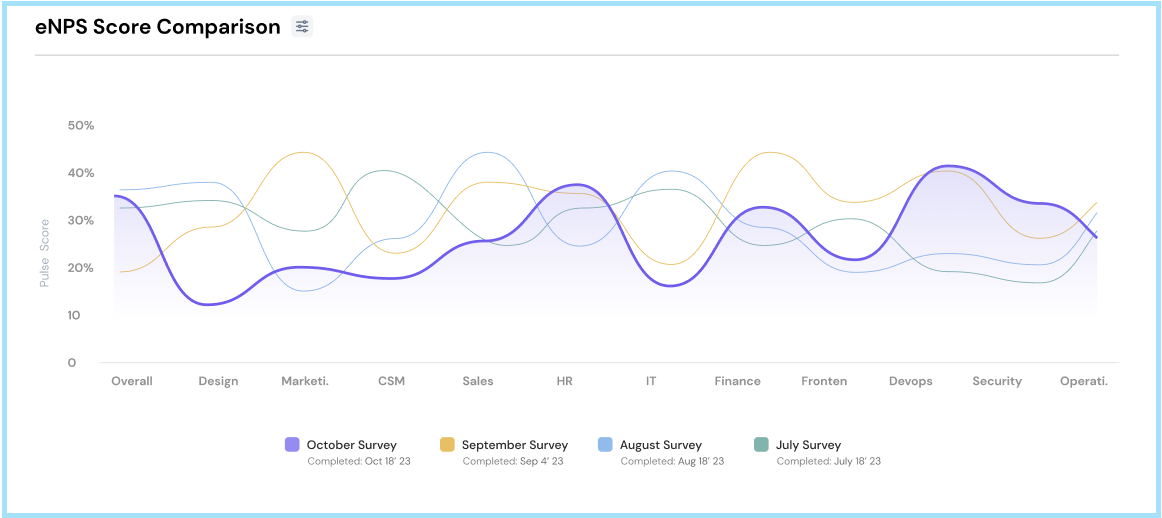
eNPS Trend Graph: Tracking Advocacy Over Time
This graph unveils trends in eNPS scores over time for each group. Here's what you can learn:
- Track progress: See if eNPS scores are improving or declining for specific groups over time.
- Identify areas needing attention: If a group consistently has a low eNPS score, investigate the reasons behind it.
By monitoring the eNPS trend graph, you can gauge the effectiveness of your efforts to improve employee sentiment and advocacy within different parts of your organization.

Turning Insights into Action:
By deciphering your eNPS report and understanding the sentiment within different employee groups, you can craft targeted strategies to cultivate a more positive and advocacy-driven work environment. Here are some ways to get started:
- Address detractor concerns: Proactively reach out to understand their frustrations and address any underlying issues they raise.
- Motivate passives: Engage with passives to understand their needs and take steps to create a more positive work experience, turning them into potential promoters.
- Recognize promoters: Thank promoters for their positive feedback and find ways to leverage their enthusiasm. Empower them to become brand ambassadors by sharing their positive experiences.
By leveraging the insights from your eNPS report and taking action, you can build a stronger employer brand, boost employee morale, and ultimately drive your company's success with a powerful force: employee advocacy. To dive deeper into pulse survey reports, click here. Should you need any help, don't hesitate to contact our support team. Happy thriving!


