Pulse survey report guide
ThriveSparrow's pulse survey reports are a treasure trove of information about your employees' engagement. This guide will equip you to not only navigate the report but also unlock the hidden messages within each section. Let's dive in and decipher what the data is telling you about your workforce.
Accessing Your Report:
- Navigate to the Engage module or the Surveys tile on the Overview page.
- Select the completed pulse survey you want to analyze and click the Reports tab.
Filtering and Grouping Options:
- Filter by: Use the dropdown menu to filter the report data by location, department, manager, gender, or job title. This allows you to see specific trends within different employee groups.
- Group by: Choose how you want to categorize the data. For example, group by department to see how engagement varies across different teams.
- Score Consideration: Select whether to view the score by favorability (focusing on positive engagement) or percentage (providing a numerical value for overall engagement).
Overview:
- Participation Rate: This shows how many employees responded to the survey. A high rate indicates good employee involvement.
- Pulse Score: Represented by a color-coded wheel (blue = favorable, yellow = neutral, red = unfavorable), this score reflects the overall employee sentiment. You can also see how it compares to previous rounds to track progress over time.
- eNPS Score: Similar to the pulse score, this metric reflects employee satisfaction and willingness to recommend your company as a workplace. This section also shows trends compared to previous surveys.

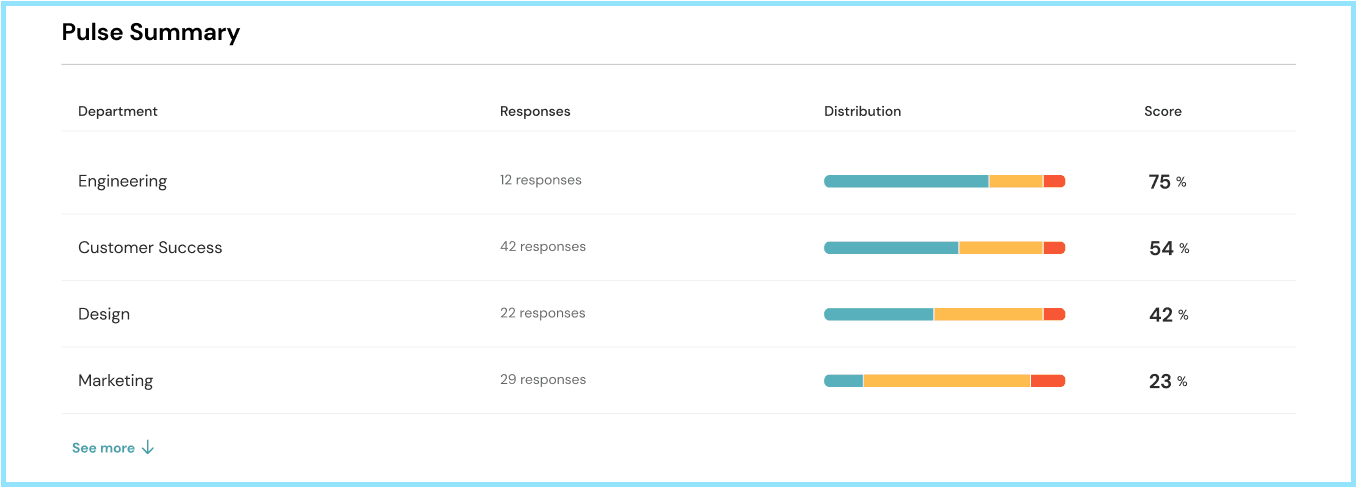
Pulse Summary:
- This section offers a deeper look based on your chosen group (e.g., department). Pay attention to:
- Number of Responses: A low number from a particular group might indicate disengagement or access issues.
- Pulse Score Distribution: The spread of blue, yellow, and red scores reveals pockets of positivity or negativity within a group.
- Pulse Score by Group: Compare scores between groups (departments, managers) to identify areas needing targeted improvement efforts.
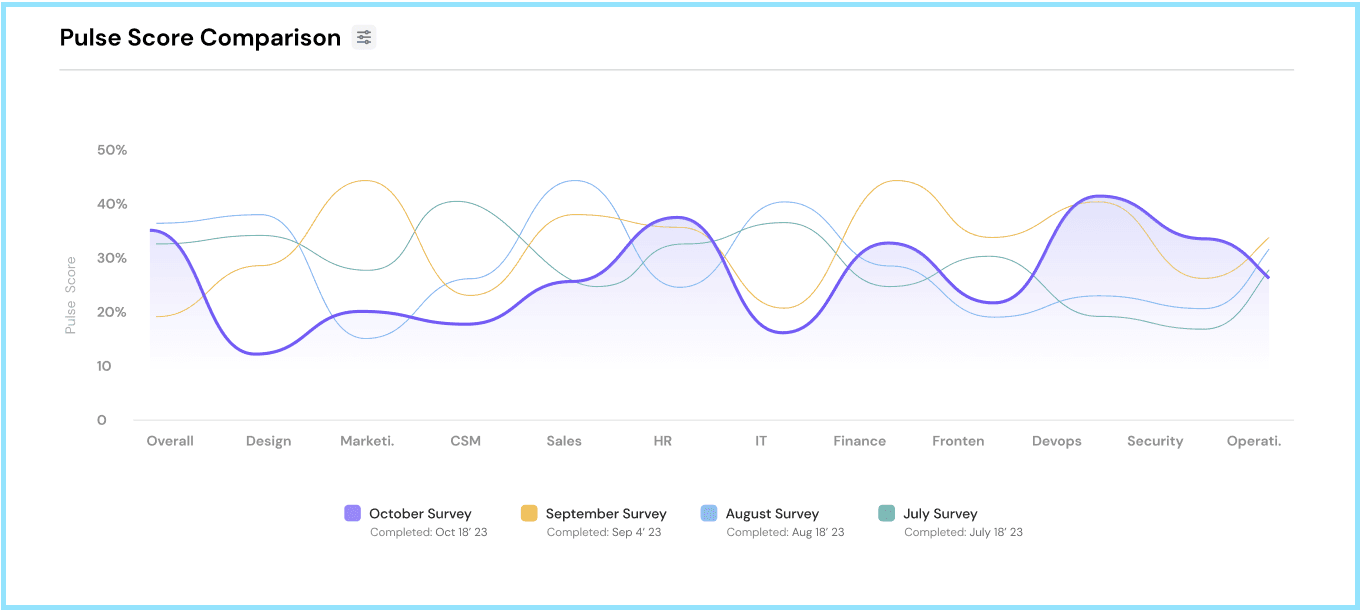
Pulse Score Comparison:
- This graph unveils trends in pulse scores over time for each group. Look for sustained improvements or identify groups where engagement consistently lags.
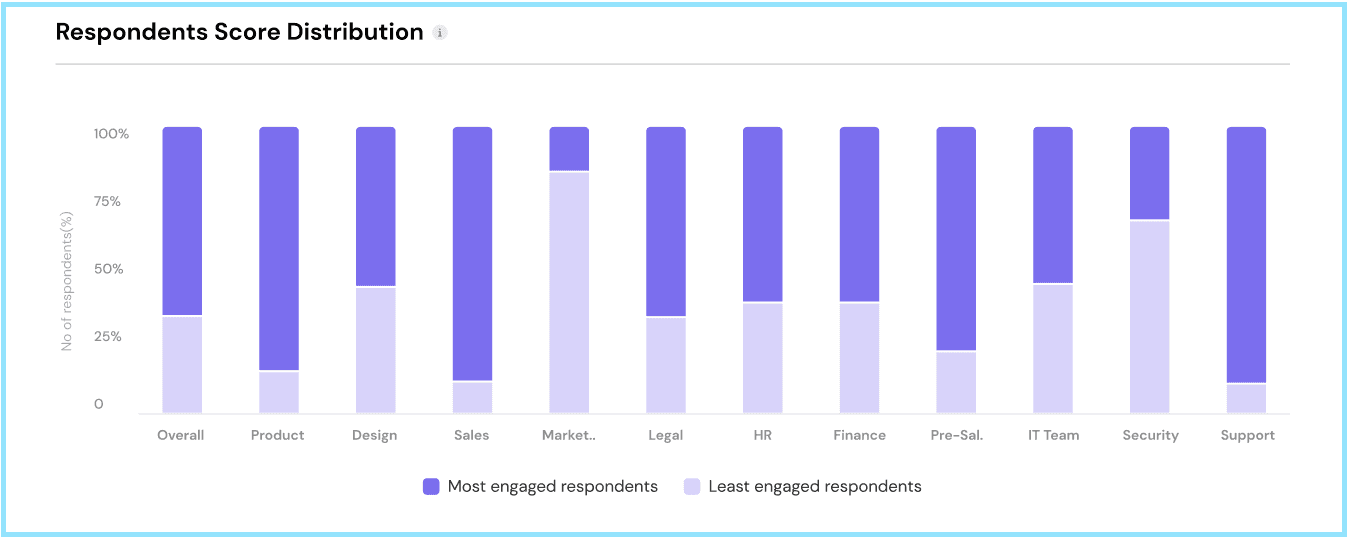
Respondents' Score Distribution:
- This bar graph displays the distribution of employee responses across engagement levels (highly engaged to least engaged) within your chosen group (e.g., department). This helps identify areas where engagement might need improvement.
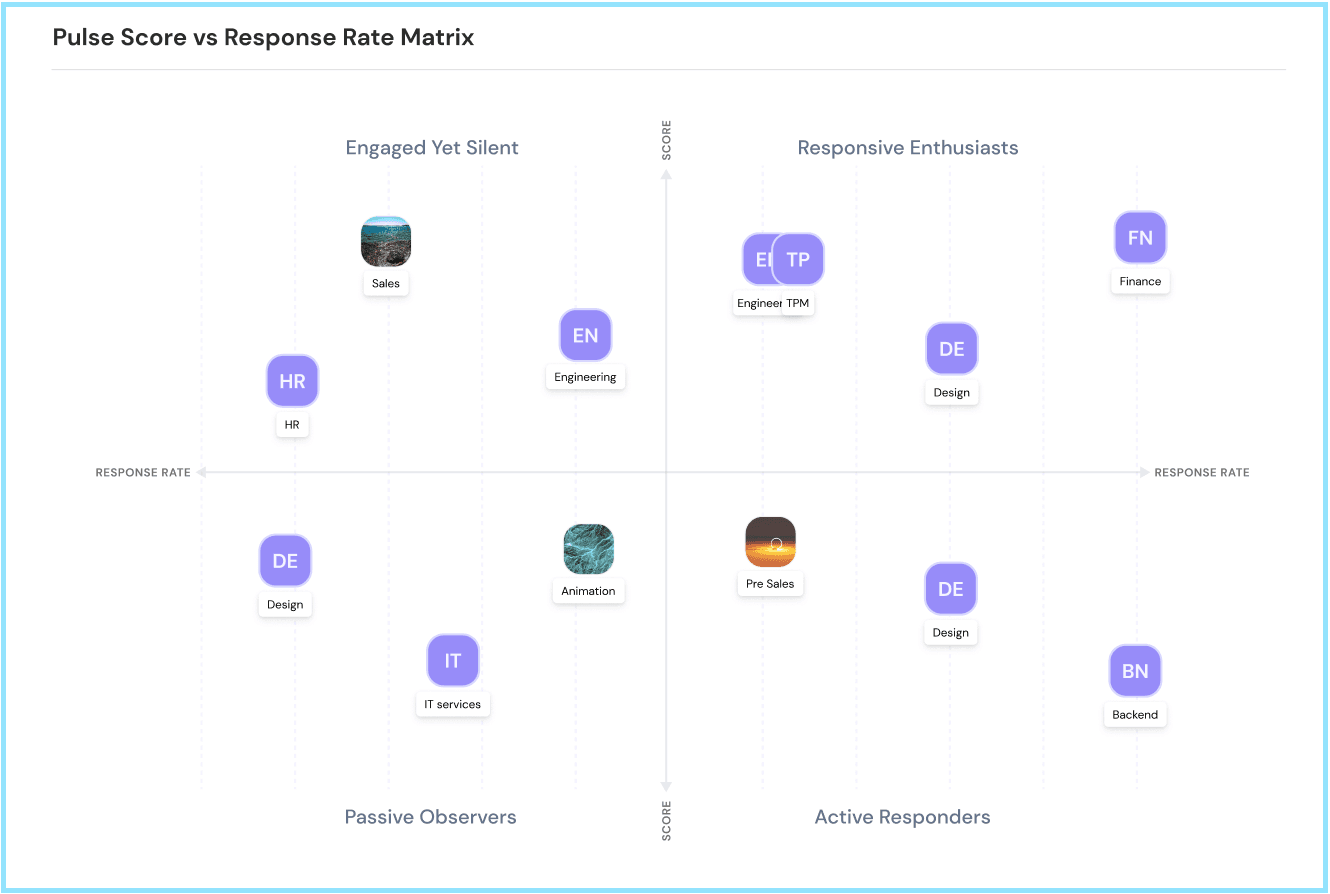
Pulse Score vs. Response Rate Matrix:
- This scatter plot categorizes groups into four quadrants, offering insights into communication and engagement dynamics:
- Responsive Enthusiasts: High response rate and high pulse score (ideally most departments should fall here). This signifies a well-connected and engaged team.
- Engaged Yet Silent: High pulse score but low response rate (encourage participation from these groups). They might be satisfied but not feel the need to speak up. Consider nudging them to share their valuable feedback.
- Active Responders: Low pulse score but high response rate (investigate reasons behind low morale). While they're actively providing feedback, their sentiment is negative. Dig deeper to understand their concerns.
- Passive Observers: Low response rate and low pulse score (encourage participation and address potential issues). This could indicate apathy or dissatisfaction. Reach out to understand their perspective and create a more positive work environment.
Heatmap:
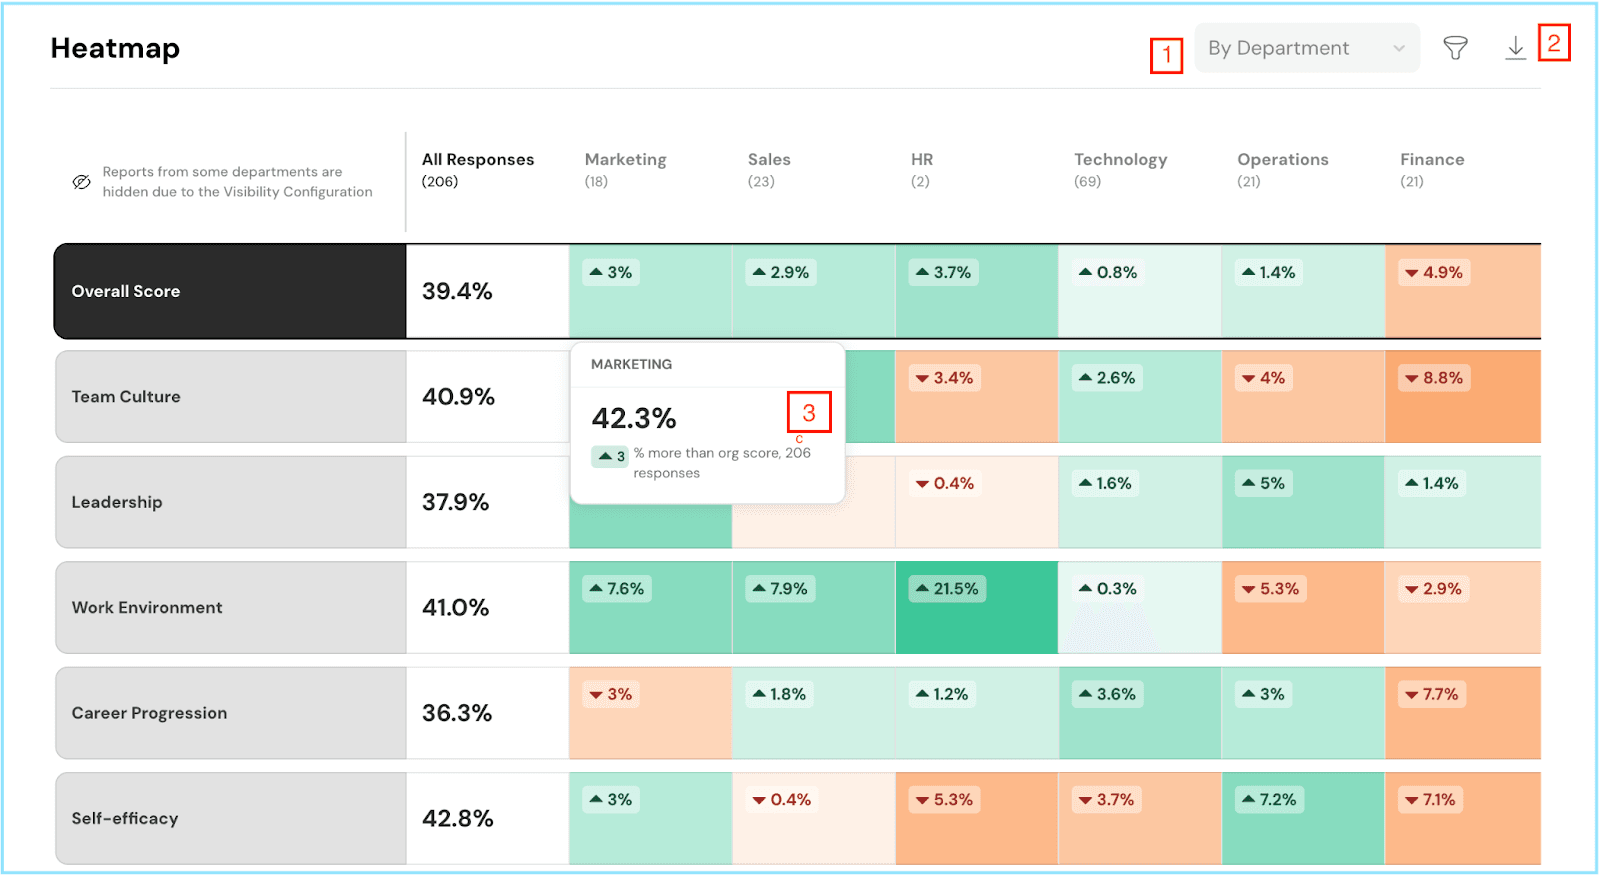
- The heatmap is a powerful visual tool. You can filter it by department, manager, location, gender, or designation by either clicking on the dropdown or the filter icon [1], and you can also download the heatmap with the download icon [2].
- It compares reporting factors against your chosen metric. Green signifies performance better than the average organizational score, while shades of orange indicate the opposite. The darker the shade, the more significant the difference. Hover over any tile for detailed insights [3].
Reports:

- By default, you'll see data for all departments. However, you can select a specific department from the dropdown menu [1].
- Here, you'll find metrics like the total number of participants and response [2], and the engagement score [3] along with the percentage distribution bar.
- Each question is displayed along with a percentage distribution bar, color-coded to reflect favorability [4].
Responses:
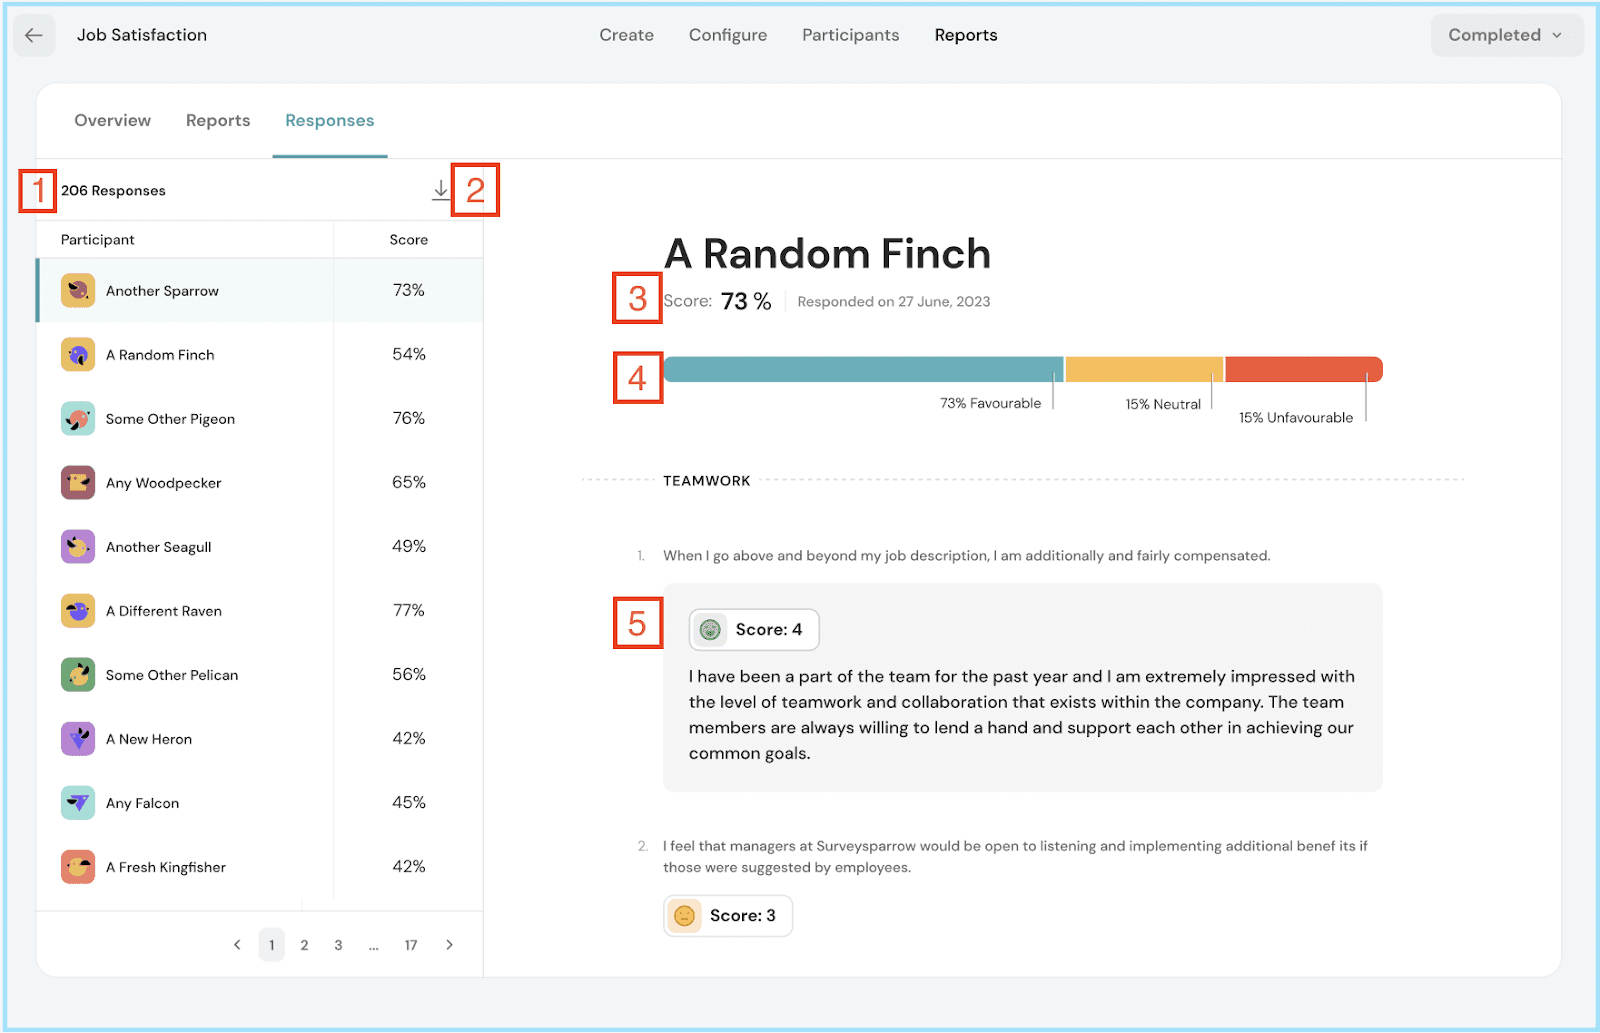
Number of Responses:
- Begin with an overview of the total number of responses [1].
- You can also download this data by clicking on the download icon [2].
Participant List:
- Here, you'll find a list of participants along with their engagement scores.
- Click on any participant to view their engagement score [3], engagement percentage distribution [4] and individual responses to each question [5] (anonymously).
By understanding these report sections and their interpretations, you can unlock valuable insights into your employees' engagement. Use this knowledge to craft targeted strategies to cultivate a more positive, productive, and thriving workplace. Should you need any help, don't hesitate to contact our support team. Happy thriving!
![]()
![]()
![]()
![]()
![]()
![]()
![]()
![]()