Engagement Survey Report Guide

Venkata
September 19, 2023
In this guide, we'll walk you through the various sections of your engagement survey report and to decode the valuable insights it holds, click here.
Accessing your Survey Report:
- Either click on Surveys in the top navigation bar or select the Surveys tile from the Overview page.
- Once inside the Surveys module, choose the completed survey for which you'd like to view the report and go to the Reports tab on the top navigation bar.
Overview:

Summary:

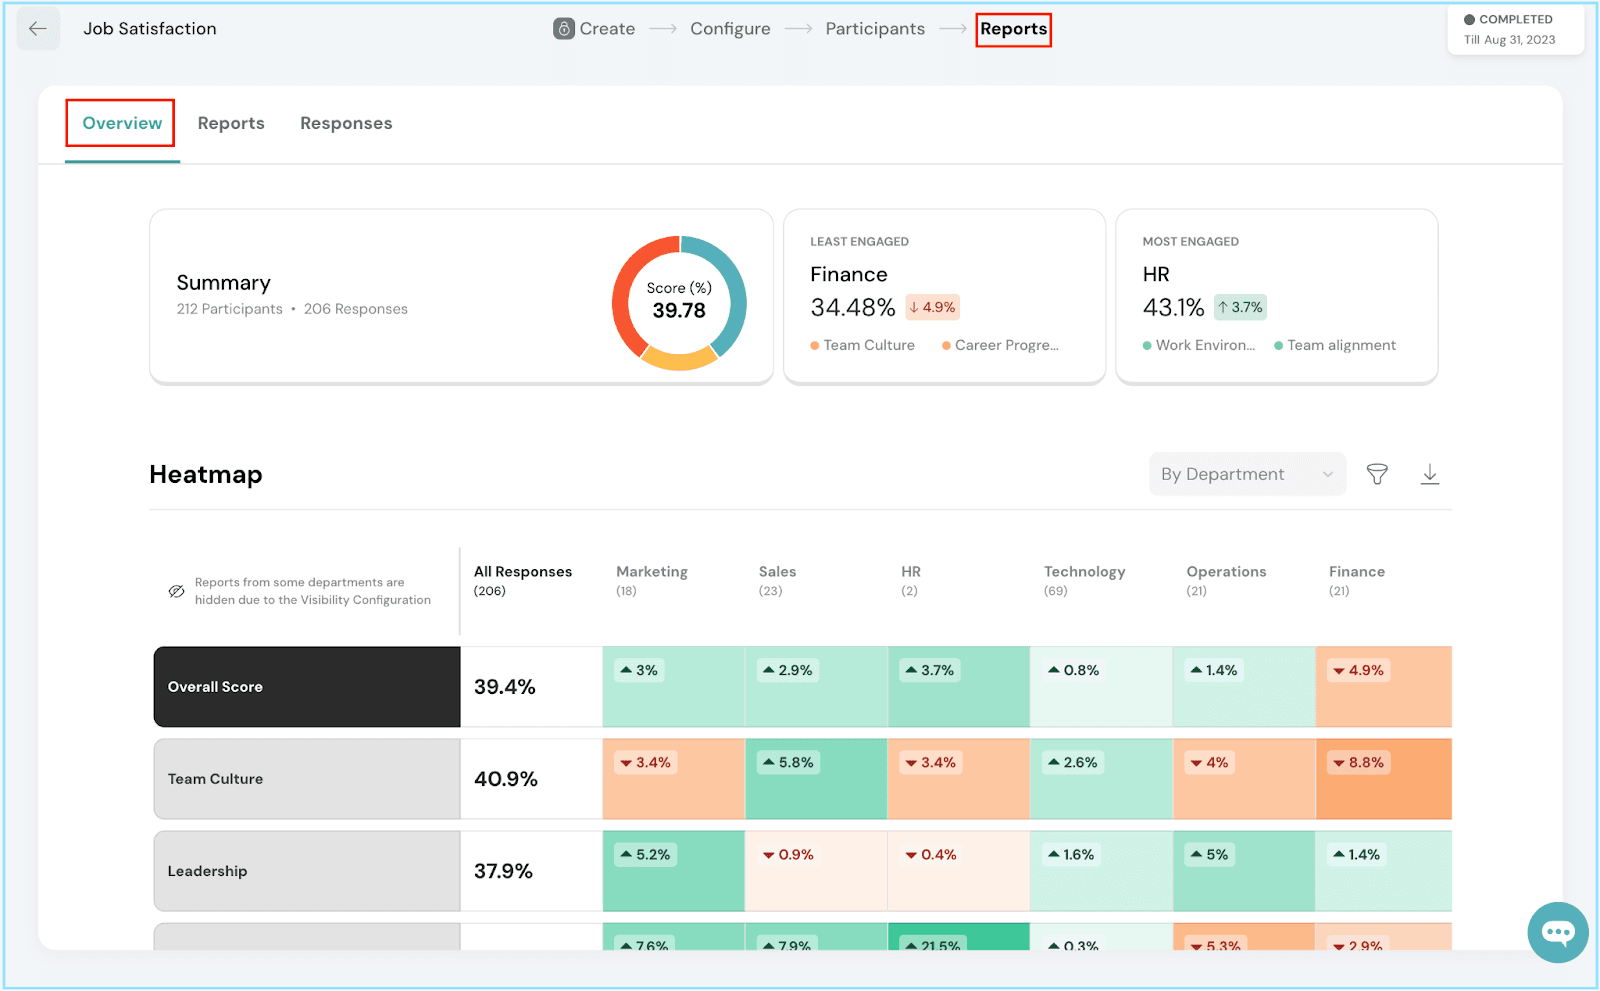
- The first section provides an overview of your survey's performance.
- You'll see the total number of participants, the total number of responses, and a color-coded wheel displaying the engagement score.
- Blue represents a favorable score, yellow indicates a neutral score, and red suggests an unfavorable score.
Least Engaged Department:
- Identify the department with the lowest engagement score.
- It will display its score, a comparison percentage with the organizational score, and the reporting factors contributing to its low score.
Most Engaged Department:
Similarly, find the department with the highest engagement score, along with a comparison percentage and the contributing reporting factors.
Heatmap:

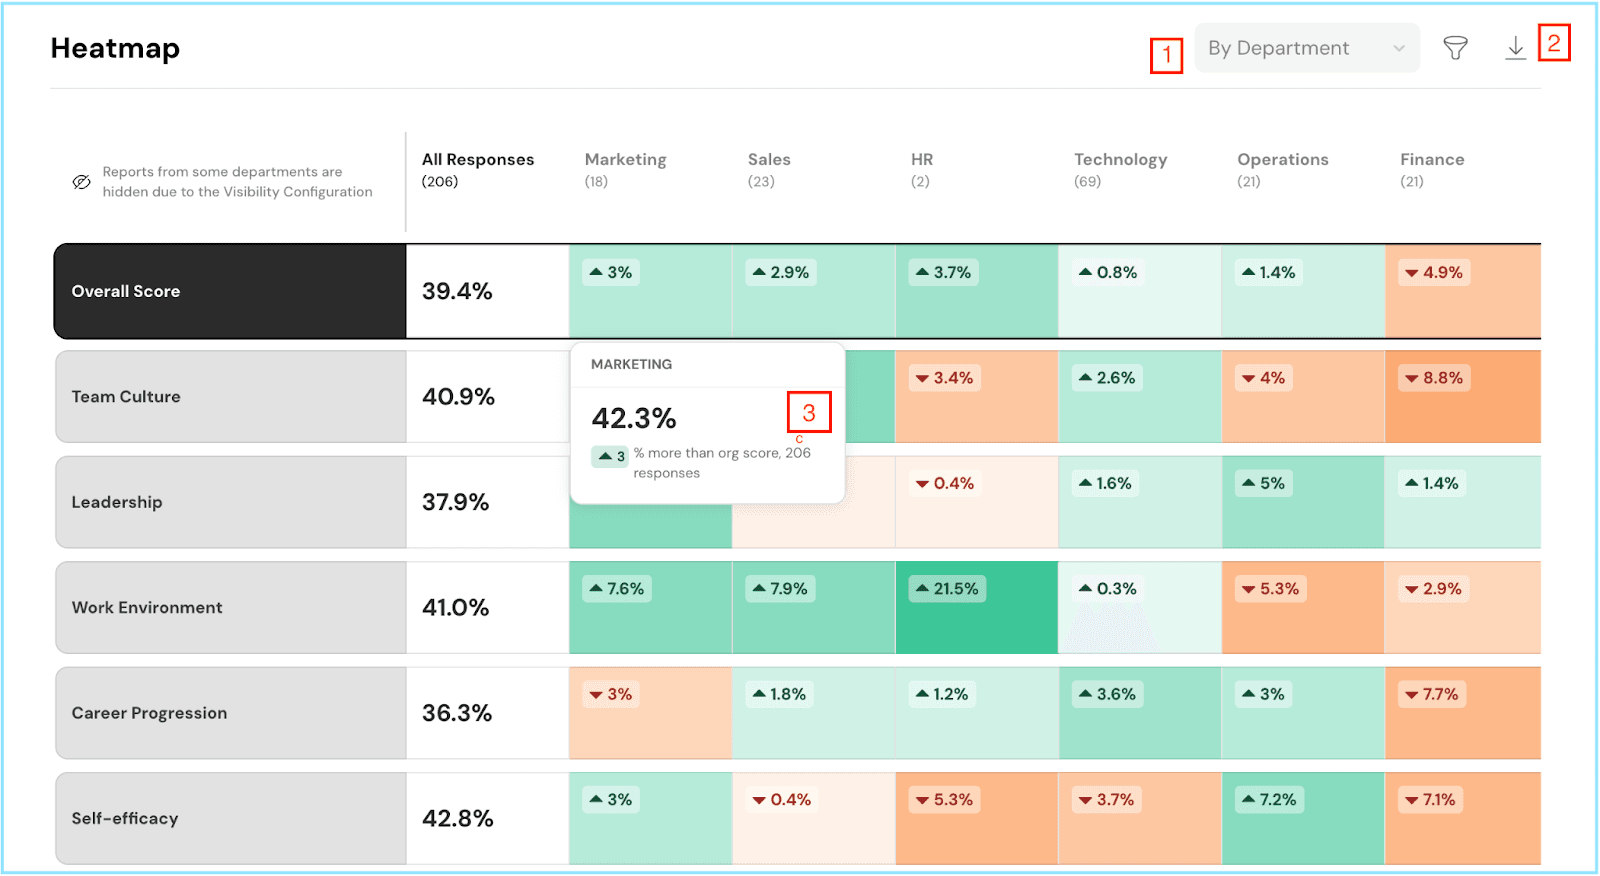
- The heatmap is a powerful visual tool. You can filter it by department, manager, location, gender, or designation by either clicking on the dropdown or the filter icon [1], and you can also download the heatmap with the download icon [2].
- It compares reporting factors against your chosen metric. Green signifies performance better than the average organizational score, while shades of orange indicate the opposite. The darker the shade, the more significant the difference. Hover over any tile for detailed insights [3].
Reports:

- By default, you'll see data for all departments. However, you can select a specific department from the dropdown menu [1].
- Here, you'll find metrics like the total number of participants and response [2], and the engagement score [3] along with the percentage distribution bar.
- Each question is displayed along with a percentage distribution bar, color-coded to reflect favorability [4].
Responses:

Number of Responses:
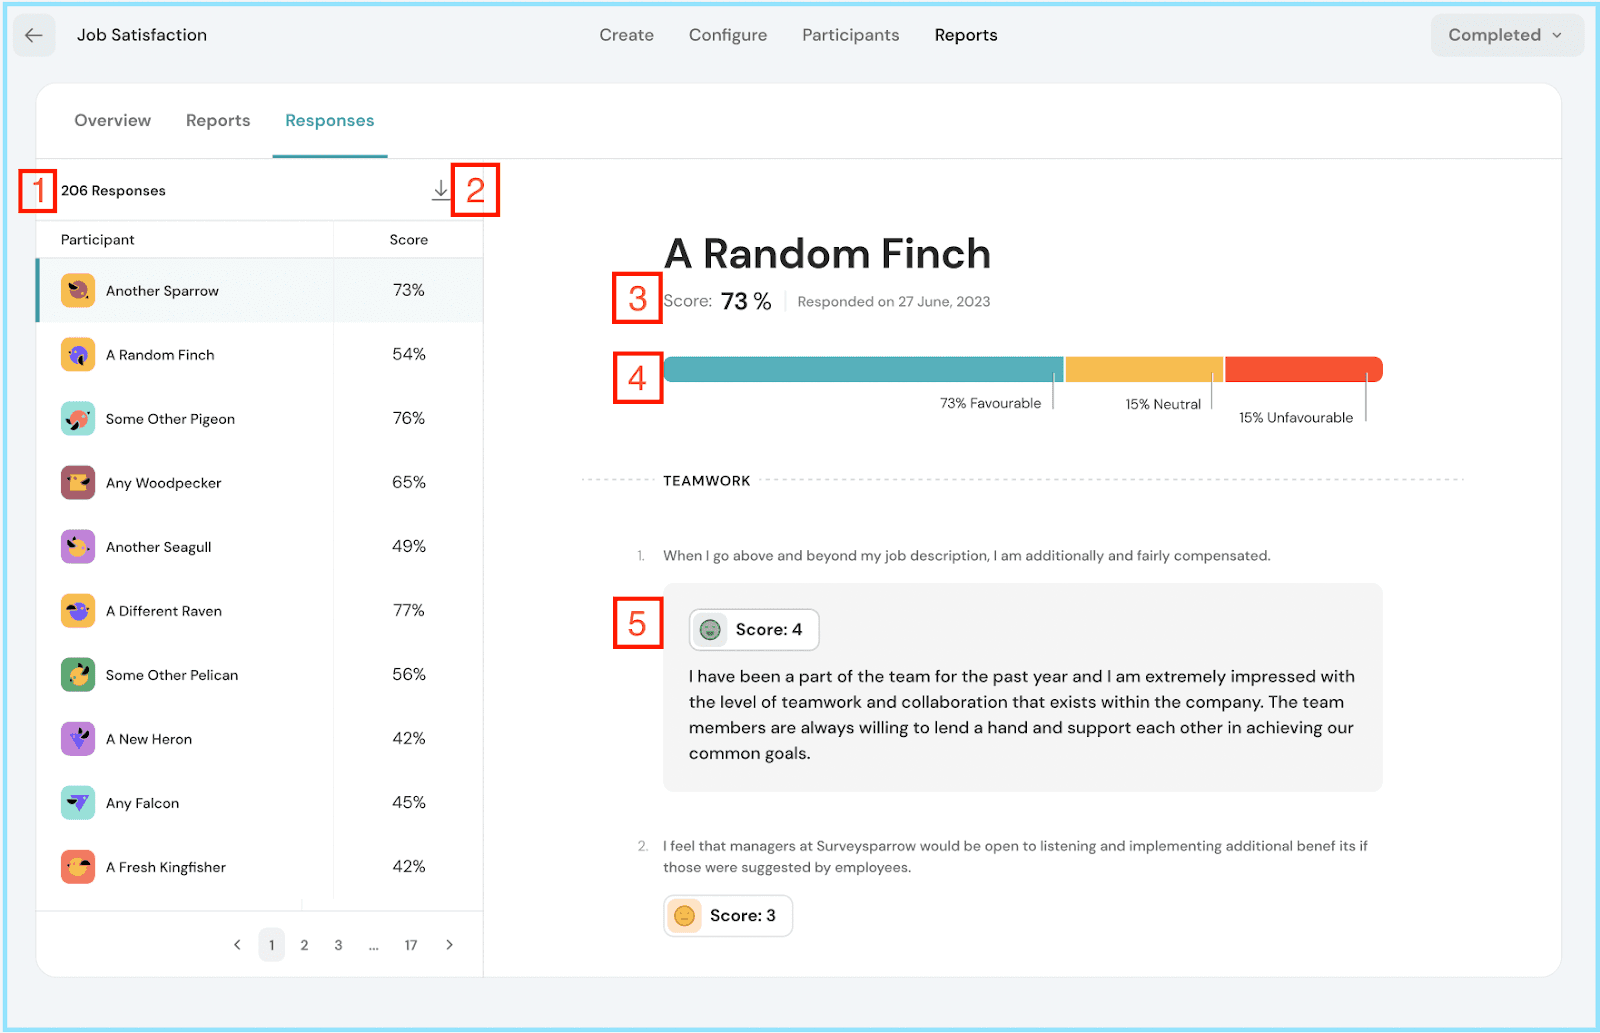
- Begin with an overview of the total number of responses [1].
- You can also download this data by clicking on the download icon [2].
Participant List:
- Here, you'll find a list of participants along with their engagement scores.
- Click on any participant to view their engagement score [3], engagement percentage distribution [4] and individual responses to each question [5] (anonymously).
With this guide in hand, you're now equipped to extract meaningful insights from your engagement survey reports and drive positive changes within your organization. Should you need any help, don't hesitate to contact our support team. Happy thriving!
![]()
![]()
![]()
![]()
![]()